Showing posts with label global warming. Show all posts

Monday, September 15, 2025

Will Earth Become Venus?

I came across an article written by economist Sanjeev Sabhlok on the long term climate future of the earth titled - Limestone proves the impossibility of a runaway greenhouse effect on Earth.  Mr Sabhlok has been reading some geology and has found out that the earth can naturally regulate the earth's carbon dioxide levels over geologic time.

The process operates like so: During times of increased volcanism, CO2 levels in the atmosphere increase to a point where the earth starts warming. This in turn enhances rock weathering reactions which pull back CO2 and washes it down into the ocean where it is sequestered as a bicarbonate or carbonate molecule. A fraction of this carbonate gets locked up in limestone precipitating on the sea floor. 

Besides this mechanism, photosynthesis also pulls out CO2 from the atmosphere. This CO2 goes into building organic molecules. Some of  that organic matter sinks to the ocean floor and is buried, creating another long term carbon sink.

All these natural adjustments to atmospheric CO2 means that a runaway increase where CO2 levels keep rising thousand fold unabated is unlikely to occur. Earth will not turn into a Venus. Mr Sabhlok says that most climate scientists ignore this natural regulator in their panic over a runaway greenhouse effect.

Mr Sabhlok has written quite a nice summary of the geological evolution of the earth's atmosphere. But he entirely misses the point about why scientists ignore geologic sequestration of CO2 in their climate change projections. They do so because it works too slowly to matter to us. Our concern is not a distant future where surface temperatures may or may not reach a Venus like 450 deg C, but one where there is a spike of 3-4 deg C in the next few decades to centuries which nevertheless will result in extreme damage to human society and the ecosystems we depend on.

The geologic thermostat that Mr Sabhlok describes can't prevent these smaller shorter time scale perturbations in atmospheric conditions. Some numbers he shares demonstrates the inadequacy of weathering to neutralize CO2 at short time scales. He quotes from a video put up by a Dr. Johnson Haas; " Typically on an annual basis … about 0.03 gigatonnes of carbon is extracted from the atmosphere and goes into limestone which goes into long-term geologic storage. … [E]ven at that slow rate the drawdown of CO2 from our atmosphere by shell building organisms … would completely exhaust the atmosphere of CO2 in less than a million years”. 

What he doesn't add is the impact of human emissions. Our activity is emitting an eye popping 40 billion tons of CO2 to the atmosphere every year. This is 2 orders of magnitude more than what limestone can suck in. About half of this CO2 gets absorbed by the ocean, the vast majority getting locked as a stable bicarbonate molecule (HCO3). The rest remains in the atmosphere, cumulatively increasing its CO2 levels. Over the past 250 odd years, human activity has increased the amount of CO2 in the atmosphere by about 1.5 trillion tons.

When emissions eventually go to zero, absorption by oceans will quickly start reducing atmospheric CO2, putting the brakes on warming. And in the long run, several hundred to a few thousand years after we achieve a net-zero emission scenario,  CO2 levels will come down to pre-Industrial amounts. But as long as emissions continue, the earth will keep warming and become a very unpleasant place. The geologic past informs us of the havoc wrecked by increased CO2 levels and a warmer earth. The Late Devonian (372 million years ago), the Late Permian (252 million years ago), and the late Triassic (201 million years ago) mass extinctions were all triggered by increased CO2 levels and warming from sustained volcanism.

The Inter Governmental Panel on Climate Change Synthesis Report outlines many scenarios that might unfold towards the year 2100. No contributing climate scientist on that report is panicking about a runaway greenhouse effect. Instead, they highlight that incremental increases in temperature over the next few decades will place a debilitating burden on our society through myriad impacts on our health, water security, agriculture, and biodiversity. While fixating on an implausible runaway effect, Mr. Sabhlok stays silent on the real impending danger that we are facing.

His sanguine advice that "We should sleep soundly, knowing that no matter how much CO2 mankind emits by burning fossil fuels, our amazing living planet will never go the way of Venus" is utterly irresponsible. 

Earth may never go the way of Venus, but if we don't stop burning fossil fuels our amazing planet will turn into a living hell for us and our immediate descendants. 

____________________________________________________________

Fun Facts: I didn't want to quibble about some of the specifics in my post, but I want to share this with you. 

1) Biocalcification (limestone formation) results in the emission of CO2! Since most of the carbonate in the ocean is in the form of HCO3, we can write the precipitation equation as- 

Ca + 2HCO3 -----> CaCO3 + H2O + CO2 --------- Eq.1. 

For every molecule of CO2 that gets locked up in limestone, one molecule is released in the ocean and eventually into the atmosphere.  Limestones over time do constitute a CO2 sink, but precipitation of carbonate sediment is not that effective an offset of atmospheric CO2 in the here and now

2)  On the other hand, dissolution of CaCO3 in the deep ocean adds alkalinity,  neutralizing the increase in ocean acidity due to CO2 released by the oxidation of organic matter. It is Eq.1. in reverse.

CaCO3 + H2O + CO2 ------> Ca + 2 HCO3 ----- Eq.2. 

Carbonate equilibria can be counterintuitive and complex! 

3) Mr Sabhlok says that "we are currently close to the lowest levels of CO2 in the Earth’s history". It is true that CO2 levels have steadily decreased over geologic time. But they have sharply increased in the past 150 years from 280 ppm in the late 1800's to more than 400 ppm today and will continue to increase as long as we keep burning fossil fuels. The last time earth saw such CO2 levels was 14 million years ago.

Thursday, June 13, 2024

Deep Sea Mining, Indian Ocean, Infectious Diseases

Some readings for you:

1) Mining the bottom of the sea: The deep sea bed is considered the last frontier on earth for mining. Large patches of the sea bed are littered with metallic lumps or nodules rich in manganese, cobalt, zinc, and nickel. These elements are considered vital for powering the world's green economy. Nauru, a tiny Pacific Ocean island nation situated northeast of Papau New Guinea, along with a Canadian mining company, wants to start mining a region of the Pacific between Hawaii and Mexico known as the Clarion-Clipperton Zone. Scientists warn that a hurried push to mine the deep ocean bed will result in an irreversible loss to biodiversity, ecologic functioning, and ocean health. Elizabeth Kolbert writes about the complex legal and regulatory issues and conflicts of interest related to international deep sea mining.

As things stand in June 2024, a deep sea mining code is still being decided by the International Sea Bed Authority. Rohini Krishnamurthy of Down to Earth has the latest news on the progress made on this issue. Negotiations are hampered by a lack of basic science and divergence of views between member states.

2) Indian Ocean headed for a near-permanent state of marine heat wave:  Rapid fossil fuel emissions over the past century or so has changed the earth's energy balance. More energy is now coming in than is being radiated out to space. More than 90% of this excess energy is ending up in the ocean as heat. As a result, the world's oceans are warming up. The Indian Ocean is warming rapidly too. Recent studies have found that it may be heading towards a scary sounding situation known as 'permanent heatwave state' where the sea surface temperatures exceed a threshold value for 220-250 days a year.

Environment and climate journalist Nidhi Jamwal summarizes the findings of this research and a new book titled The Indian Ocean and its Role in the Global Climate System. The consequences are far reaching, impacting tropical cyclones, biodiversity, and fisher folk livelihood.

3) Probing the pathogens that afflicted ancient humanity: Pathogens and humans have been co-evolving for millennia. Paleoanthropologist John Hawks charts out the history of some of the common infectious diseases afflicting humanity. Infection patterns are not random. Rather, they follow networks of transmission shaped by ecology and culture. Very illuminating essay!

Tuesday, November 28, 2023

Volcanic Versus Human Carbon Dioxide Emissions

A couple of weeks ago Iceland awaited with much anxiety as magma made its way to the surface. A volcanic eruption seemed imminent. That danger seems to have passed for now. Seismicity has abated and magma may not break through and erupt.

Misunderstandings regarding climate change though shows no signs of receding as this comment shows - 


 Source: X - https://twitter.com/dremtee/status/1723427183182446871

Ever so often it is worth putting up the numbers:

Anthropogenic CO2 emissions - About 40-50  billion tons per year.

Volcanic CO2 emissions - Approximately 500 million tons per year.

Terry Gerlach of the U.S. Geological Survey has compiled global data on volcanic emissions  -  Volcanic Versus Anthropogenic Carbon Dioxide, published in EOS Transactions American Geophysical Union. 

This article is from 2011, but there are good explanations on volcanic emission rates and the observed discrepancy (which has increased in the 12 years since publication) between anthropogenic and volcanic emissions. 

What conditions limit volcanic CO2 emissions on present day earth? 

On average, magma contains about 1.5 weight percent dissolved CO2. Estimated annual magma production on earth amounting to about 80 billion tons won't create near enough volcanic CO2 to match human emissions. About 850 cubic kilometers of magma would be needed to be generated annually to create volcanic CO2 on an anthropogenic scale. So much magma production either under land or sea would not have gone unnoticed. 

Short lived volcanic eruptions like past events in Iceland, or Mt. Pinatubo, or Mt. St Helen's, although violent and spectacular,  didn't emit more than a few million tons of CO2. These amounts are too small to have a discernible warming effect. Large explosive eruptions in fact might cool the earth by a degree or so for a short time because the sulphur particles they emit reflect sunlight back in to space.

Can volcanism cause global warming? Yes, but over much longer time scales. 

Weathering of surface silicate rocks consumes about 500 -700 million tons of CO2 per year, offsetting the amount emitted by volcanoes. There has to be sustained volcanism at high emission rates for decades to hundreds of years to create an imbalance between weathering and volcanism and change climate. 

Cin-Ty Lee and Slyvia Dee 's  commentary on this subject explores the role of volcanism on global climate. 

Thursday, October 26, 2023

Photomicrograph: Mineral Filled Vesicle

I came across this stunning image of a mineral filled vesicle on the September 2023 cover of Geology. The rock sample was collected from the Louisville Seamount Chain in SW Pacific Ocean.

 Source: Elmar Albers et.al. 2023- Timing of carbon uptake by oceanic crust determined by rock reactivity.

Vesicles in igneous rocks are spherical holes formed by expanding gas bubbles. As lava erupts, dissolved gases bubble out. Lava solidifies fairly rapidly on exposure either to air or water. The bubble shape is retained as a small cavity. It gets filled with minerals when magmatic fluids and mineral saturated seawater or groundwater circulate and react with the rock. 

The basalt rock in this study is about 50-74 million years old. The calcite in the vesicle precipitated within 8 million years of eruption. Alteration of undersea basalt is a CO2 sink. Basalt reacts with seawater, trapping carbon in carbonate minerals. The calcium required for formation of carbonate minerals is provided by the alteration of minerals like plagioclase. The study is trying to estimate how long such carbonation reactions continue. Carbonated oceanic crust eventually sinks into the mantle at subduction zones sequestering carbon from the surface for hundreds of millions of years.

This particular vesicle is filled with carbonate (calcite) and clay. Notice the beautiful banding suggestive of pulses of mineral formation. Among the brown and white layers are white bands of faceted saw tooth calcite. And the upper part of the vesicle is filled with large irregular shaped crystals. Surrounding the vesicle is the 'groundmass', made up of tiny crystals of plagioclase feldspar, iron oxide, and volcanic glass. There is no scale in the picture, but my guess is that the vesicle is a few hundred microns across.

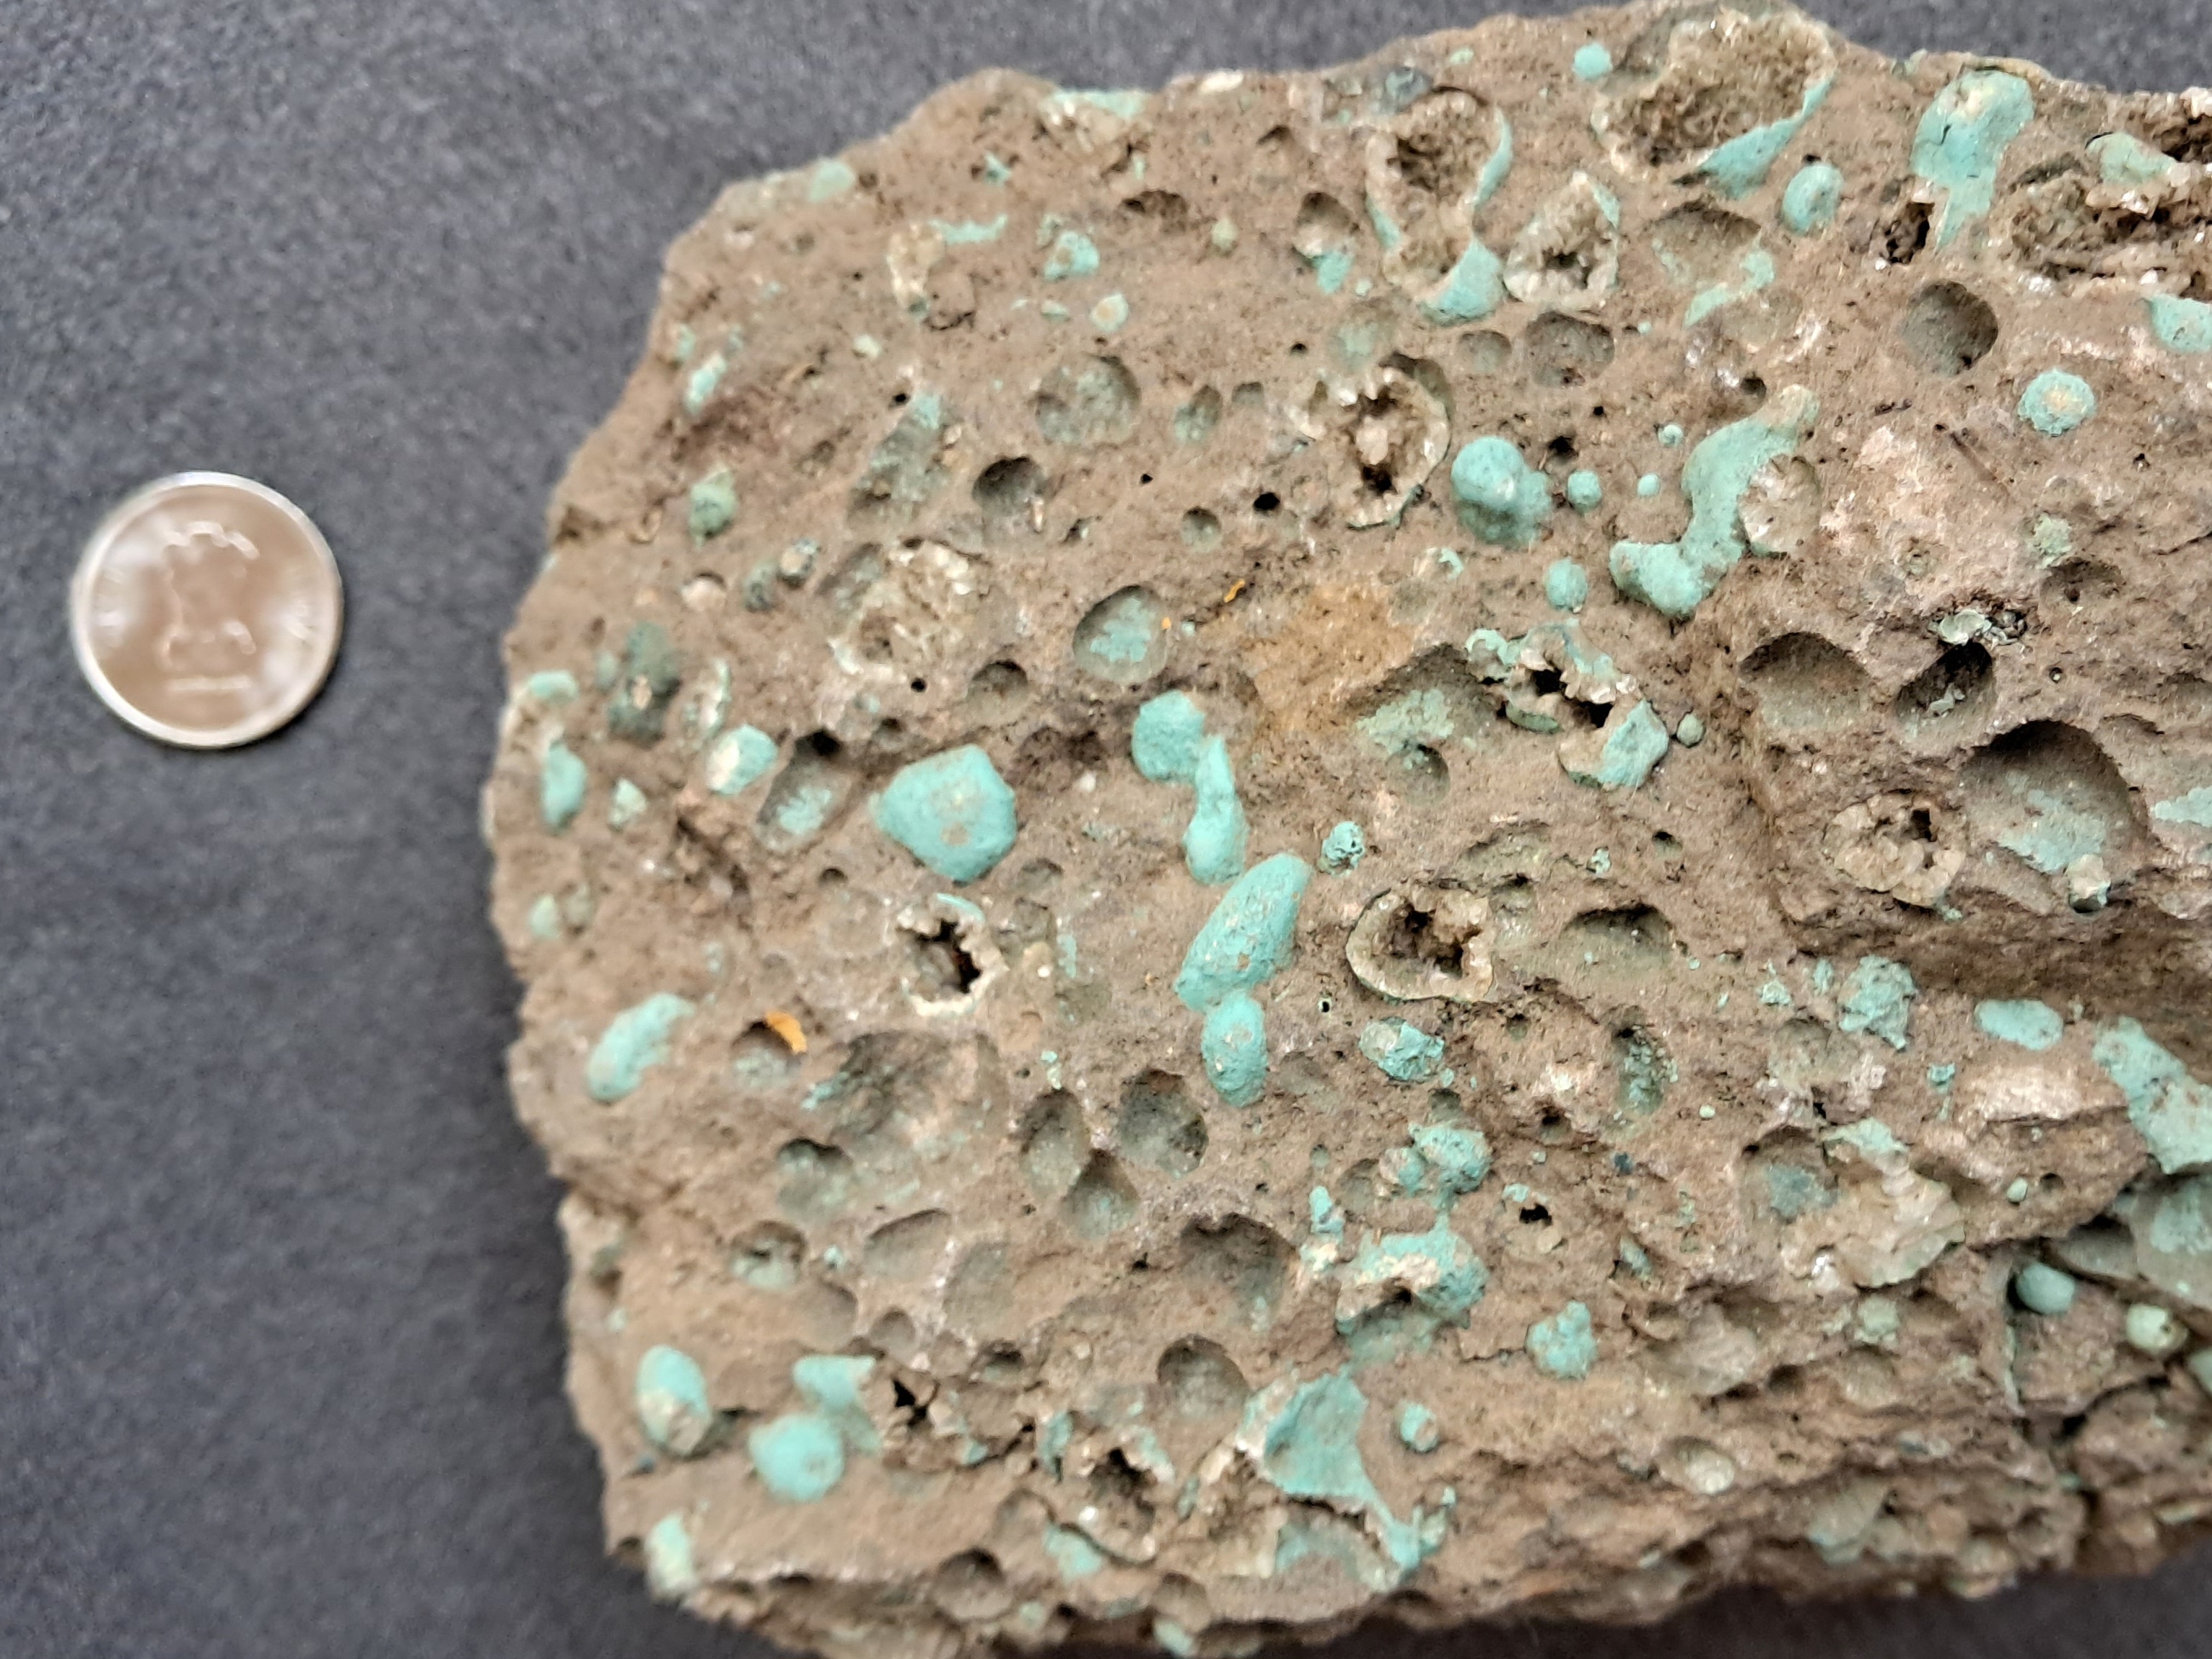
In a hand sample a vesicular basalt will look like the example below. This is from the Deccan Traps near Pune. 

The vesicles here are much larger than the first example. Many are empty. Some vesicles have a lining of tiny crystals. Carbonation of terrestrial basalts also constitutes a carbon sink.  Combating global warming and achieving net zero emissions will require, foremost, a steep reduction in emissions, but additionally also removing carbon dioxide from the atmosphere and safely storing it in long term reservoirs. Such carbon removal and sequestration projects are exploring the potential of basalts and related igneous rocks as a long term carbon sink. 


Monday, August 21, 2023

Darwin's Earthworms, Ocean Currents, Geology Heritage Lost

My latest set of readings.

1) Why Darwin Admired the Humble Earthworm. A delightful essay by Philip Ball on Darwin's work on earthworms. Published towards the end of his career, this book apparently sold more copies than the Origin of Species! As Philip Ball wittily observes, that tells us something about the English passion for gardening. Darwin's research on earthworms consisted of detailed observations and cleverly designed experiments, often carried out with the help of family members. 

His powers of observation and analysis remained undimmed - "Darwin reported that 80 percent of leaves he removed from worm burrows had been inserted tip first—a far from random distribution".

2) No, the Gulf Stream isn't going to shut down. The premise of the movie The Day After Tomorrow is that of a catastrophic cold snap engulfing north America and Europe, triggered by the shutting down of the Gulf Stream. This massive ocean current forms in the subtropics in the western side of the Atlantic and transports heat from the lower latitudes to northern Europe, moderating the temperatures in these northern regions. Media reports claim that recent work might be pointing to a collapse of the Gulf Stream, but as Frank Jacobs explains, people are conflating two very different current systems. 

Some studies are suggesting that the Atlantic Meridional Overturning Circulation, a much smaller and restricted circulation system, might be slowing down and might even collapse by 2050. This will result in some cooling in the Greenland and Norwegian seas, but will not affect the larger Gulf Stream. The article has a nice animation of global ocean currents which I found informative.

3) They Have Put Geology in Coffins. For long, geologists have been complaining about the utter indifference shown by successive Indian governments to our natural heritage. Here is one more example from Himachal Pradesh. Along the Kalka-Shimla highway, on the stretch between Parwanoo and Solan lay a treasure. This was a section of sedimentary rocks recording the retreat of the Tethys Sea which began after the collision between India and Asia started creating high topography. Along this stratigraphic section, marine sediments give way to freshwater deposits. The outcrop was a natural outdoor laboratory for students and researchers. Now it is gone. The National Highway Authorities of India has covered it with concrete and stone walls. Science is the big loser again. 

Arundeep Ahluwalia expresses the anguish of geologists who knew and loved this part of the Himalaya- "It forever denies coming generations any chance to study the long stretches of such highways and to the nature lovers in society the excitement of the history and grandeur of the earth".  

Read and weep. 

Sunday, July 16, 2023

Links: Early Life, Critical Minerals, Net Zero Emissions

Some interesting readings over the past couple of weeks.

1) In a Fierce Desert, Microbe ‘Crusts’ Show How Life Tamed the Land. Zack Savitsky describes a fascinating research program underway to study microbial life in the fierce Atacama Desert in Chile. These organic communities are called 'grit crust'. They coat pebbles and large sand grains on the desert floor. A closer examination has showed that they are composed of hundreds of species of cyanobacteria, algae, fungi, along with lichen combinations. These microbes play an important role in the biogeochemical fixation and cycling of elements and over millennia break down rock and enrich the soil in nutrients. They also give scientists a glimpse on how life may have first colonized land, perhaps as early as the Archean. 

2) Digging into India’s critical minerals dash. Recently, the Indian Ministry of Mines released the Critical Minerals for India report. India has also approved commercial mining for minerals containing the following elements —lithium, beryllium, titanium, niobium, tantalum and zirconium. These elements are raw materials for magnets used in wind turbines and EV motors. M Rajshekhar writes about the geological distribution of these elements and global supply chains, pointing out the challenges India faces in procuring a reliable supply of these materials necessary for its energy transition away from fossil fuels. 

3) Explainer: Will global warming ‘stop’ as soon as net-zero emissions are reached? Even if we stop emitting CO2 today, we are locked into hundreds of years of warming because of past emissions. I too have uttered these words, but it turns out that I, and many others, have been conflating two separate scenarios: constant concentrations versus zero emissions. Zeke Hausfather clarifies what these two different situations mean and how they will differently impact CO2 levels and future warming. 

Net zero CO2 scenario will very quickly stabilize temperatures or even slightly cool the earth, but that will also depend on emissions of  other confounding variables like aerosols and other greenhouse gases. Aerosols by blocking sun's energy have a cooling effect. On the other hand, achieving net zero too far in the future might still result in warming due to the feedback effects of other greenhouse gases like methane and nitrous oxide. Good explainer!

Tuesday, June 13, 2023

Links: Human Brain Evolution, Pyrometamorphism, Upper Atmosphere Cooling

I learned some new things from these articles over the past couple of weeks.

1) Endocranial Volumes and Human Evolution: Warning- this figure posted below is deceptive!

Although hominin brain volumes increase over a 7 million year history, patterns of growth in separate lineages show, both, stasis & episodic increase. In an excellent analysis, anthropologist Ian Tattersall shows that a trend towards large brain volume is expressed independently in three separate hominin lineages, raising important questions about the role of social interactions and environmental pressure that could lead to the evolution of larger brain size. And most intriguingly, brain volume size has decreased in the Homo sapiens lineage over the past few tens of thousands of years. What does it mean for the evolution of complex behavior and symbolism?

2) Scorched Minerals in Sedimentary Rocks: Petrologist Michael Anenburg reports a most unusual suite of minerals. They formed by pyrometamorphism, i.e., the transformation of sedimentary rocks by heat supplied by large fires. This process takes place at or very near the surface, likely driven by the ignition of oil bearing shales or coal seams. The rocks described here are from the Dead Sea area of Israel. Before metamorphism, they were a sequence of impure limestones and phosphorites. There is a memorable description of these combusted limestones in the paper; 

" Gross discovered that the Hatrurim Formation was fundamentally a natural Portland cement factory. Indeed, many of the synthetic compounds found in cement occur naturally in the Hatrurim Formation and were subsequently named after the local Hebrew or Arabic place names in which they were found, such as hatrurite, ye’elimite, and harmunite. Concrete is formed when Portland cement is mixed with water, and the pyrometamorphic minerals of the Hatrurim Formation have experienced a similar process. Hundreds of thousands to millions of years of exposure to rain and groundwater has led to the hydration and alteration of most of the high temperature minerals. The end result is essentially a naturally formed concrete". 

3) The Upper Atmosphere Is Cooling, Prompting New Climate Concerns: The earth's atmosphere is layered. While the lowermost  layer known as the troposphere is warming as we emit more and more carbon dioxide, satellite data shows that the two uppermost layers, the mesosphere and the thermosphere have cooled by 3.1 deg F between 2002 and 2019. Scientists worry about the impact of this cooling on weather patterns on earth. A succinct summary by Fred Pearce.


Author Contact: suvrat_k@yahoo.com

Wednesday, April 26, 2023

Links: Crust Evolution, CO2 Emissions, DNA Structure

I'm posting a reading list after a long interval. Hope you like this selection. 

1) Secular Evolution of Continents and Earth Systems. The earth's outer shell has evolved and changed in its chemical and mechanical properties over time. This long term evolution has had profound consequences for geological and biological processes. Peter A. Cawood and colleagues have written an informative article in Reviews in Geophysics on the geologic history of the continental crust and its value as an archive for earth processes. The paper is open access, and there is also a shorter Q &A with lead author Peter Cawood which I have linked to in the title. 

2) Carbon dioxide removal is not a current climate solution. What is the best approach to limiting global warming? Do geoengineering methods which remove CO2 from the atmosphere offer a way out? David T. Ho, using a simple and effective explanation, refutes that notion and argues convincingly that drastic emission cuts is the only way to slow down temperature rise.  

3) Rosalind Franklin's contribution to the discovery of DNA's structure. 1953 was a standout  year in our understanding of life with the publication of papers proposing a structure for DNA. Rosalind Franklin's role in this story has been either sidelined or misunderstood until recently. The authors of the linked essay, Matthew Cobb and Nathaniel Comfort, are writing biographies of Francis Crick and James Watson respectively. They recently went through Rosalind Franklin's notes and some other unpublished documents which helped them piece together a different account of the discovery of the structure of DNA and Rosalind Franklin's key insights. 

This essay goes beyond the popular eureka moment narrative which held sway over people's imagination for a long time. Instead, we find collaboration between the teams working on this problem and many twists and turns before Watson and Crick came up with the solution. The article also raises important issues of ethics and sexism in science. 

Monday, September 26, 2022

Readings: Earth's Ice, Neanderthal Women, Indian Monsoons

Some good stuff from the past few weeks.

1) How much of the Earth's Ice is Melting? Sid Perkins writes about the variety of methods of estimating ice loss from the high latitudes. These methods are showing where and how much melting is taking place, in turn, helping scientists make predictions of future sea level rise. The overall scenario is rather gloomy. 

2) The Lives of Neanderthal Women. "Archaeology is no exception to biases against women’s interests across science and the humanities". Archaeologist Rebecca Wragg Skykes expertly constructs a picture of what the lives of Neanderthal women might have been like.

3) Indian Monsoon Across Millennia. Stalagmites from a cave in Meghalaya, NE India are giving paleoclimatologists information about monsoon variability over a thousand years. Their geochemistry points to periodic deadly droughts that coincide with phases of major social and political turmoil in India. Paper authors Gayatri Kathayat and Ashish Sinha describe their research. 


Friday, February 4, 2022

Human Impact On Earth's Sediment Cycle

One common type of argument I hear from anthropogenic climate change deniers is that human activity is too insignificant to affect the balance of global natural processes. On one debate a participant claimed that one large volcanic eruption emits more carbon dioxide than that by human activity. The actual amounts contradict this claim. Volcanism on earth emits about 0.13 -0.44 billion tons of CO2 per year. Human activity on the other hand emits about 35-40 billion tons of CO2 per year.

Jaia Syvitski and colleagues have produced a similar eye opening review of the human impact on earth's sediment cycle. The production, mobilization , transport, and deposition of sediment is based on a balance between tectonic processes, climate, erosion, and human activities. Our impact on sediment movement and its sequestration has now become so large that it dwarfs natural processes. 

The paper is open access for a limited time. Earth's sediment cycle during the Anthropocene

It is dense reading, full of numbers on sediment loads and fluxes.

"Human activities have increased fluvial sediment delivery by 215% while simultaneously decreasing the amount of fluvial sediment that reaches the ocean by 49%, and societal consumption of sediment over the same period has increased by more than 2,500%".

or: The Indus River once transported about 270 million tons of sediment to its delta. It presently deposits only about 13 million tons per year. So much of Indus water is siphoned off by canals, that it  often turns dry before reaching the sea.  

 and one more: "Large dams have trapped about 3,200 Gt of sediment since 1950 (ref.123), approximately 74% of which would likely have reached the coastal ocean". (Gt =billion tons)

There are many such stories from around the globe about the staggering amounts of sediment extracted and redirected for human use. Next time, don't shrug off the news you read about unregulated sand mining from our rivers. It is causing serious damage to riverine and coastal ecosystems.

The review ends with a proposal to set up a ‘Earth Sediment Cycle Grand Challenge’, a collaborative effort to better understand the changes to the sediment cycle. Such an initiative we surely need to address the many ongoing and future threats to our rivers and deltas.

Tuesday, June 15, 2021

Lessons From A Hot Past

This short editorial published recently in Nature Geoscience is worth reading and thinking about. It summarizes our findings of past climate change and how earth systems such as sea level, glaciers, and the biosphere responded to these climate swings. 

Reconstructing temperatures going back to the Eocene (~50 million years ago) and later in the Miocene (~ 15 million years ago) reveal a very different world. These finding do come with a caveat. The rates of change are averaged over thousands of years, while we today stare at an unfolding catastrophe in our lifetimes. 

There is data though from more recent times that can tell us in finer temporal detail how climates fluctuated. Carbon dioxide trapped in Antarctica ice sheets points to changing atmospheric composition on a centennial scale and tree ring data informs us about seasonal changes in rainfall.

The current level of CO2 in the atmosphere of about 415 ppm (parts per million) are the highest since the Pliocene, more than 3 million year ago. We are also pumping CO2 at rates which are unprecedented in geologic memory, a shift from about 280 ppm to our present levels in just about 150 years The past may not provide a perfect analogue for the rapid changes we are experiencing, but it does send us a sobering warning that civilization's envelopes of comfort will be breached not so far in the future.

Nature Geoscience Editorial: Lessons From A Hot Past.

Monday, July 20, 2020

Infographic: Milestones In Climate Science

Prof. Katharine Hayhoe and Skeptical Science tweeted this infographic showcasing the history of climate science. There is a long article by John Mason on this topic on the Skeptical Science site.


Beautifully compiled by John Garrett. Especially telling is the close parallel between rising carbon dioxide levels and rising temperature (the blue and green lines), a fact that the fossil fuel industry has tried mightily to suppress. Don't get taken in by their subversion of this obvious connection.

Thursday, August 24, 2017

Field Photos: Glacial Deposits Of The Darma Valley, Kumaon Himalaya

During my recent trek to the Panchachuli Glacier in the Kumaon Himalaya, I obsessed about observing changes in metamorphic grade of the Greater Himalayan Sequence on the trek route and also about finding the South Tibetan Detachment fault system. I wrote about this in an earlier post.

But there were other interesting geological observations too. The Panchachuli Glacier has left a thick record of glacial deposits. The river Dhauliganga originates from this glacier. Along this river valley, glacial deposits can be observed to a distance of at least 5 kilometers downstream of the present location of the snout of the glacier, indicating that the glacier was much more extensive in the past. Tributary glaciers flowing out of the ranges east of the Dhauliganga have also left an extensive record in the form of thick fluvio-glacial deposits. These can be observed as far south as the village of Baaling.

We heard anecdotes in village Dugtu about how this glacier was much bigger in living memory and how it has been receding rapidly in the past few decades. On one level such stories are believable because studies of Himalayan glaciers have shown that many of them have been shrinking over the past few decades (ref). This is partly due to anthropogenic global warming, but glacial response to warming may be varied due to local variations in topography, precipitation and wind conditions. Some glaciers don't show retreat while some are actually seen to be expanding. Overall though, there a substantial ice loss observed across the Himalaya. Exactly how much of that is due to recent global warming and how much, as some scientists caution, due to natural factors is still being studied. Sustained warming though will cause these glacier to shrink further over the next century.

There is also a longer geological story of glacial advance and retreat written in these deposits.

I've embedded below an annotated interactive map of the glacial deposits of the Dhauliganga river valley in the Panchachuli Glacier area. This will enable readers to zoom in and recognize the various glacial landforms present in the valley. You can also access it via this Permanent Link.


The annotations depict:

a) The dark blue lines are the snout of the glacier.
b) The light blue lines are the recent terminal moriane fields.
c) The pink lines are older lateral moraines.
d) The yellow lines are outlines of older fluvio-glacial deposits
e) Numbers 1 -12 mark the locations of glacial deposits.

I have mapped only a few representative examples of each of the feature types. Readers can use these to explore similar features scattered throughout the valley. 

Location 1: This is the snout of the glacier. It is a mass of ice and frozen mud. The river Dhauliganga emerges out of an ice cave.


Location 2: Taken from near the snout of the glacier looking downstream. Ridges of the terminal moraine can be seen in the foreground. The arrows in the background outline a ridge of an older lateral moraine. Notice how the ridge decreases in elevation downstream suggesting that the terminus of this older glacial phase in somewhere nearby downstream.


Location 3: The older lateral moraine can be clearly seen as a sharp ridge line (arrow) separated from the valley wall by a depression. 


This moraine top is a few hundred meters above the valley floor implying that the glacier was thicker in the past. When was this lateral moraine deposited? It may be at least a few hundred years old. In the Garhwal Himalaya, similar older lateral moraines close to the glacier has been dated to be several hundred years old. They have been interpreted to be a result of glacial growth and deposition during the Little Ice Age, a period of earth cooling and climate instability that lasted from around the 1300's to the mid 1800's (for more on this climatic episode, I recommend Brian Fagan's book The Little Ice Age: How Climate Made History 1300-1850).

Location 4: A view of the glacier and an older lateral moraine (arrow) on the other side of the valley.


Location 5: Further downstream are thick glacial deposits. The river has incised or cut through these sediments. As a result the deposits form flattish plateaus or terraces that hug the mountain slopes. Village Dugtu, where we stayed, has been built on top of one such glacial terrace. The arrow in the top picture points to an exposure of these glacial deposits. A close up of this deposit is seen in the bottom picture. Notice the extremely ill sorted texture. Such ill sorted sediment deposited by glaciers is called Till. Large boulders are mixed in with  gravel, pebbles and much finer sized rock flour (the light to brown colored matrix).


Location 6: Another exposure of a glacial deposit near Dugtu. Again, notice the ill sorted deposit. However, at the top is a well sorted pebbly layer. This suggests deposition in more vigorous flowing water. Glacial retreat from time to time would have resulted in the establishment of a fluvial regime and deposition in these streams. These deposits may be a few hundred to several thousand years old.


Location 7: The glacial terrace on which village Dugtu is built is seen in the lower right corner. Farther away is village Philam built on the thick fluvio-glacial deposits of a tributary glacier originating in the range east of Dugtu. At village Dugtu, the east flowing river Dhauliganga makes a sharp southerly turn. The river has cut through these deposits and the slopes of the valley are thickly forested suggesting the great antiquity of these deposits.


Location 8: A nice view of glacial deposits south of village Baun along a smaller tributary of the  Dhauliganga. Notice the waterfall!


Location 9: A walk right through these thick fluvio-glacial deposits along a forested section of the valley slope. Again, notice the ill sorted nature of the deposits. Glacier are viscous and cannot sort sedimentary particles like water or air can. The result is a jumble of boulder, gravel and rock flour.


Location 10: Another cliff made up of fluvio-glacial deposits. I'm calling the deposits east of Dugtu as fluvio-glacial, since I observed intervals which show layering. This suggest deposition in water, either in streams or in melt water lakes and ponds that form in front of glaciers.


Location 11: A thick sequence of fluvio-glacial deposits along the Dhauliganga river. If you zoom and pan the satellite image you can recognize these terraces  southwards almost up to the village of Baaling.


I did not observe such deposits south of Baaling. However, there are smaller glaciers, such as the Naagling glacier, originating in the ranges on either side of the Dhauliganga. There would be smaller deposits scattered in these tributary valleys.

I have been vague about how old these deposits could be. If we assume that the Panchachuli glacier would have attained its maximum extent in the Pleistocene during the Last Glacial Maximum about 20,000 years ago, then the deposits furthest away from the present location of the glacier would be the oldest. As the glacier recedes one should find younger and younger deposits closer to the active glacier.

A study by Dirk Scherler and colleagues in the Garhwal Himalaya found such a pattern. They studied deposits of the prominent Jaundhar Glacier and the Bandarpunch Glacier in the Tons Valley. I've posted below a map showing the interpreted ages of deposition of glacial sediments.


 Source: Scherler et. al. 2010

Notice how the oldest deposits are further away from the present location of the glaciers (eastern most extremity of the map). These oldest deposits point to the maximum extent of the glacier that was reached in the Pleistocene during the Last Glacial Maximum.  However, the decreasing ages of the deposits upstream aren't the result of a uniform recession of the glacier. Instead, they point to several glacial episodes during which the glacier advanced, then receded, and then advanced again during the Holocene. Their data shows five such episodes of glacial growth dated to approximately 16 ka (ka = thousand years ago), 11-12 ka, 8-9 ka, 5 ka and less than 1 ka.


It turns out that the climate history of the Holocene is not one of uniform warming since the end of the last glacial period. The earth has gone through several minor cooling phases during the Holocene. The well known Younger Dryas Event around 12.9 -11.7 ka is one example.  Some studies suggest cooling episodes around 8.2 ka  and around 4.2 ka . And there is the Little Ice Age during the last millennium.

Another climate dynamic is fluctuating monsoon strength through the Holocene. The authors don't favor the explanation that these periods of glacial growth were triggered by global cooling events.  They argue that glacial growth corresponds to small phases of increased monsoon strength interrupting a longer trend of decreasing monsoon strength. More moisture means more snow and glacial growth. Since the long term trend in this part of the world is one of decreasing monsoon strength, every successive phase of glacial growth was smaller than the previous, resulting in younger and younger deposits upstream. The Little Ice Age deposits (which were likely driven by global cooling and not necessarily increased precipitation) mark the last major phase of glacial growth.

How are these deposits dated? Scherler and colleagues use a technique known as cosmogenic nuclide dating. This technique is one way to date the timing of surface exposure. Glaciers carry rock debris. These form a layer below the moving ice. When the glacier recedes the rock debris is deposited as a moraine or as an erratic boulder. It is exposed to the atmosphere and starts getting bombarded by cosmic rays. Energetic cosmic ray neutrons falling on atoms of minerals like quartz results in spallation reactions. This means that the collision of neutrons is energetic enough to fragment the nucleus. Oxygen bound up with silicon in the mineral quartz gets converted to an isotope of Beryllium (10Be). The amount of nuclides generated this way is proportional to the length of exposure. By measuring the amount of 10Be and comparing it with other isotopes, an 'exposure age' is estimated. This is essentially the age of glacial recession and the deposition of glacial sediment.

Samples have to been selected carefully for this method to give a true estimate of surface exposure and deposition. Care must be taken to avoid sampling rocks that have been repeatedly buried and exposed. Rocks which show signs of being subjected to prolonged glacial erosion are selected since  erosion will remove outer shells of material that may have accumulated nuclides during an earlier period of exposure.  Debris with a polished surface or with striations and grooves generally suggest subglacial transport and prolonged glacial erosion and are preferred samples.

 The figure below taken from the same study shows the reconstructed glacial extents using exposure dates of the moraine sequences in the upper Tons Valley.


Source: Scherler et. al. 2010

Such dating of glacial deposits at other locations in the Garhwal Himalaya (ref) tell a similar story of glacial growth and decay over the Holocene. And what about the Pleistocene? Is there evidence of older glacial cycles in the Himalaya? There are many studies that have identified glacial phases during the Pleistocene as well. For example, in northwest Garhwal, the Bhagirathi Glacial Stage has been dated to 63 ka (ref). And in the Ladakh Himalaya the oldest glacial stage has been dated to 430 ka (ref). Pleistocene ice ages have impacted glacial dynamics in the Himalaya too although more work needs to be done to understand the specific mechanisms of glaciation.

Location 12: Its back to the Dhauliganga valley floor. This moraine ridge (arrows) may be the remnant of an older terminal moraine. It is located about 2 kilometers downstream of the glacier.


The Panchachuli and other glaciers in the Kumaon region to the east of the Garhwal will also have their own history of past glory and recession. How much of the retreat of the Panchachuli and other Kumaon glaciers due to recent global warming?  And what is its fate? Hopefully, someone will study them with more precision in the future.

Tuesday, December 1, 2015

India And Climate Change- Productivity Challenge

This is a serious essay. But this passage made me laugh out loud-

Because any imaginable path of development involves making massive amounts of steel, ramping up production at Jharia is a top national priority. Achieving Modi’s billion-ton target, company officials tell me, will require the colliery to increase its output by about 15 percent a year.

The men and women who must accomplish this huge task work in a landscaped headquarters that during my visits is full of people standing around in hallways and lobbies without obvious purpose. One morning I interview an able young engineer. Jammed into the other half of his office are a half dozen older men, one of them his supervisor, drinking tea and telling stories. The interview lasts nearly two hours. During that time the other men do not move. Phones do not ring. Email alerts do not ping. Keyboards lie untouched. The office door opens only to admit flunkies with tea on a tray. Leaving the engineer’s office, I wonder if the activists who protest India’s coal expansion plans would be comforted by this scene. Increasing productivity is going to be no easy task.


Charles Mann writes about the two paths- one solar and the other coal- that India seeks to take to develop and at the same time manage its carbon emissions. The preferred pathway according to Charles Mann's assessment is tilting towards coal.

I  kinda agree. The current government is coming up with innovative ways to speedily access India's coal deposits. One aspect of the damage by the increasing reliance on coal that he did not bring up (besides air pollution) is the destruction of some of India's best forest land in the eastern part of the country. Environmental parameters that are used  to define inviolate forest areas are being  diluted to ease the handover of forest land to mining. That means destroying biodiversity and also means a threat to water security and water quality. Even if the next generation of coal power plants are cleaner, India will pay dearly in environmental costs of lost forest cover and degraded water supply.

I am not  trying  to make light of the challenges that India faces, but with nuclear energy taking a backseat because of large capital costs and a whole different set of environmental fears and no prospect of  a quick ramping up of natural gas from conventional and shale gas reservoirs (reserves may not be enough anyway),  I don't see how reliance on coal can be reduced in the near future.

Sunday, October 25, 2015

Low Emissions Due To Ecofriendly Lifestyles? India's Climate Roadmap

India has submitted its Intended Nationally Determined Contribution to the United Nations Framework Convention on Climate Change. It is a sort of a road map the country will take with regards to future carbon emissions, mitigation and adaptation.

On page two I came across this gem:

Even now, when the per capita emissions of many developed countries vary between 7 to15 metric tonnes, the per capita emissions in India were only about 1.56 metric tonnes in 2010. This is because Indians believe in nature friendly lifestyle and practices rather than its exploitation.

What a load of bollocks!

Anyone familiar with the reality of life in India will recognize this as a specious attempt to explain away the low per capita emissions.

Emissions in India are low not because of nature friendly lifestyles but because of deep poverty. Hundreds of millions of people don't have access to enough energy... and the energy they are forced to exploit like burning cow dung, charcoal, wood and rubbish to sustain themselves is deeply injurious to their health.

On the other end of the spectrum, emissions from the increasingly affluent classes living mostly in cities are beginning to catch up with the developed world.

Nagraj Adve and Ashish Kothari critique the road map. It is not "nature friendly".

Wednesday, September 16, 2015

Coral Reefs, Atolls And Sea Level Rise

Will coral reefs and atolls (coral islands) be able to keep pace with the current and projected sea level rise and remain geologically stable in the coming decades and centuries? Will atolls in  the Pacific and Indian Oceans remain habitable?

Regarding  the first question,  I came  across a couple of recent  studies that suggest that reef growth in the Pacific, Indian and Caribbean seas has historically and in the geological  past been able to keep pace with sea level rise of magnitudes equal to or even greater than the current rate of change of sea level.

In a recent issue of  Geology, P.S Kench and colleagues study six time slices of shoreline position of the Funafuti Atoll in the tropical Pacific Ocean and find out that there has been no loss of  island due to erosion by sea level rise. This part of the Pacific has experienced some of the highest measured rates of  sea level rise amounting to about 5 mm per year over the past 60 years. Their analysis showed that reef islands in this group shifted their size, shape and positions in response to sea level rise.

What could be happening? Coral reefs are prolific producers of carbonate skeletal material. As sea level rises, corals grow upwards and outwards from established communities keeping pace with the sea level rise so as to remain in the optimum water depth range. Wave energy keeps breaking down corals and produce carbonate sand which then gets redistributed and deposited in adjacent areas including island beaches. Corals thus form a renewable supply of sediment that balances sediment lost to erosion. Thus coral islands, although may change in shape and position due to changes in depositional locus will not experience any net loss of land.

Studies which go back in geological time also seem to confirm that coral reefs have often extraordinary growth rates that they can sustain for centuries and may keep up with extremely rapid episodes of sea level rise. In a special issue of Sedimentology ( Feb 2015 Open Access) on carbonate response to sea level change, Gilbert F. Camoin and Jody M. Webster document very rapid coral growth rates  using age constrained fossil coral reefs from Barbados in the Caribbean Sea and from atolls in the Pacific and Indian Oceans.

Their results show that following the melting of the global ice caps beginning around twenty thousand years ago, coral reefs kept pace with high rates of sea level rise amounting to 6-10 mm per year and astonishingly in places like Tahiti, for periods of a few  centuries, amounting to 45 mm per year. This very high rate dated to 14.65 k to 14.3 k corresponds to a Melt Water Pulse i.e. an accelerated rise in sea level due to collapse of portions of the ice sheet. Healthy reef growth means a steady supply of sediment to replenish coral island beaches, thus maintaining geological stability through periods of sea level rise.

This suggests that many coral atolls will not simply vanish beneath the waves as sea level rise in the coming centuries, although they will change their shape and positions. The other danger besides sea level rise is the changing chemistry of sea water and other biological changes that might harm coral growth. Sea water acidification may slow down the capacity of corals to build calcium carbonate skeletons, although again, studies on the impact of changing pH on coral growth have shown mixed results, with ill effects on some coral species in some locations, while others seem to have sufficient internal buffering capacity to maintain normal growth patterns. Increasing sea water temperature may also result in a) expulsion of symbiotic algae that corals depend on, thus slowing down their growth and/or b) infection by parasites that might harm the coral animal. So, there is still much to worry about the health of coral ecosystems as the earth warms and ocean temperatures rise.

Now to the second question - will coral atolls remain habitable? Habitations on these islands are built on a foundation of dead coral communities and sand which are not going to be lifted up in response to sea level rise. Although the fringing living reef communities will supply sediment to these islands, powerful storms and high tides will still pose problems. Reefs don't form water tight sea walls around these atolls and tidal surges will bring sea water further inland.

Another problem is the impact of sea level rise on groundwater. Many of these island  communities rely on a thin fresh water aquifer for their water supply. The foundation of these islands is porous Pleistocene limestone. Holocene coral communities and sand is piled up on this Pleistocene foundation to build the island. The fresh water aquifer usually occurs in this Holocene sediment. The pores and fractures in the Pleistocene limestone below the fresh water lens is filled with sea water. The contact between the fresh water aquifer and the underlying sea water aquifer is called the Thurber Discontinuity. The graphic below shows a typical cross section and hydrogeology of a coral atoll.


 Source: Bailey et. al. 2010 adapted from Ayers, J.F.; Vacher, H.L. Hydrogeology of an atoll island: A conceptual model from detailed study of a Micronesian example. Ground Water 1986, 24, 2-15

What will be the impact of sea level rise on this fresh water lens. This is an active area of study and early results seem to suggest a variety of outcomes with small fresh water lenses further diminishing while larger ones persisting. This is a complex topic with a variety of controlling parameters like amount of eustatic sea level rise, island size and shape and island topography which will channel the extent of storm wave washover. As sea level rises over the next few decades and centuries, especially on coral atolls which are experiencing erosion and loss of land, the danger of salinization of the fresh water lens is a real possibility, which will make living on these islands a difficult proposition.

Tuesday, September 8, 2015

Understanding Global Warming- Consensus Via Committees

This is an important summary by Spencer Weart, historian emeritus at the American Institute of Physics, Maryland, on the growth of our understand of the risks posed by global warming. He does not point to any particular scientist or specific scientific papers that provided "breakthroughs" in our understanding of climate change and global warming. Instead, he says that the real actors were various committees set up to collate the diverse research done on climate change and to come up with a consensus on the risks climate change poses to humans.

A closer look, if I had much more space, would certainly turn up plenty of individuals, along with lots of mistakes and controversies about details. Each new idea was first brought up by someone and then argued out at length. Our history of committees is like the swan that glides serenely on the surface while paddling furiously underneath. Still, I haven’t been telling a Whig history, reconstructing after the fact an understanding that never existed at the time. In this peculiar case a consensus was constructed by committees on the fly, a consensus that became increasingly detailed and certain decade by decade. The topic was so important that people recognized very early on that it could not be left to a few individuals making statements to the newspapers. Experts had to analyze the entirety of the peer-reviewed literature, even have elaborate computer studies done expressly for their use, and get together to hammer out conclusions that everyone could agree were scientifically sound. To be sure, in some areas they could only agree on the extent of their uncertainty, but that, too, was a genuine and important scientific conclusion.

and this on public perception ..

I submit that a major problem in communicating climate realities to the public is that the media, and everyone else addressing the public, feature individual scientists and their discoveries and disagreements. We have scarcely come to grips with committee consensus, a different kind of history of science. You will find no account digging into details of committee deliberations. I haven’t been able to do it here, and I am not sanguine about prospects for getting it done. In fact, the IPCC and the NAS and their members have been highly reluctant to make public any documents or recollections about just what goes on in the committee deliberations. Only recently, under pressure from critics, has the IPCC made its review process entirely transparent to the public. Be that as it may, I suggest historians and social scientists should give more attention to those committees. If we did, the public would have a better idea of how “science” comes to say what it does say about global warming —and a good many other issues.

Read the article here..

HT @aboutgeology 

Monday, August 17, 2015

Global Warming Hiatus And Internal Natural Climate Variability

This is worth sharing. A short but useful explanation of the global warming "hiatus" and the natural variability of different atmosphere-ocean phenomenon that influence global mean surface temperature (GMST) trends.

From the article-
 
Every decade since the 1960s has been warmer than the one before, with 2000 to 2009 by far the warmest decade on record (see the figure). However, the role of human-induced climate change has been discounted by some, owing to a markedly reduced increase in global mean surface temperature (GMST) from 1998 through 2013, known as the hiatus (1–3). The upward trend has resumed in 2014, now the warmest year on record, with 2015 temperatures on course for another record-hot year. Although Earth's climate is undoubtedly warming, weather-related and internal natural climate variability can temporarily overwhelm global warming in any given year or even decade, especially locally.

And an excerpt about the role of the Pacific Decadal Oscillation-

There is also strong decadal variability in the Pacific Ocean, part of which is the Pacific Decadal Oscillation (PDO) (see the figure, panel B). The PDO is closely related to the Interdecadal Pacific Oscillation (IPO) but has more of a Northern Hemisphere focus. Observations and models show that the PDO is a key player in the two recent hiatus periods (2). Major changes in trade-winds, sea-level pressure, sea level, rainfall, and storm locations throughout the Pacific and Pacific-rim countries extend into the southern oceans and across the Arctic into the Atlantic (7–9). The wind changes alter ocean currents, ocean convection, and overturning, for example affecting the Atlantic Meridional Overturning Circulation (10). As a result, more heat is sequestered in the deep ocean during the negative phase of the PDO (1, 6, 9, 11, 12). GMST therefore increases during the positive phase of the PDO but stagnates during its negative phase (see the figure) (13).

more here..

Thursday, May 14, 2015

Ocean Acidification- What Exactly Happens?

I've started following @Scitable, an education resource from journal Nature. A few days back they tweeted a link to an article on ocean acidification.

Pay attention-
 
When CO2 dissolves in seawater to produce aqueous CO2 (CO2(aq)) it also forms carbonic acid (H2CO3) (Eq. 1; Figure 1). Carbonic acid rapidly dissociates (splits apart) to produce bicarbonate ions (HCO3-, Eq. 2). In turn, bicarbonate ions can also dissociate into carbonate ions (CO32-, Eq. 3). Both of these reactions (Eqs. 2, 3) also produce protons (H+) and therefore lower the pH of the solution (i.e., the water is now more acidic than it was — recall that pH is the negative logarithm of the proton concentration or activity, -log10[H+]. Note, as illustrated in Figure 2, Ocean Acidification does not imply that ocean waters will actually become acidic (i.e., pH < 7.0).

CO2(aq) + H2O ↔ H2CO3 (1)
H2CO3 ↔ HCO3- + H+ (2)
HCO3- ↔ CO32- + H+ (3)
 
However, when CO2 dissoves in seawater it does not fully dissociate into carbonate ions and the number of hydrogen ions produced (and the drop in pH) is therefore smaller than one might expect. This is due to the natural capacity of seawater to buffer against changes in pH, which can be represented simply by:

CO2(aq) + CO32- + H2O → 2HCO3- (4)

where CO2 is effectively neutralized by reaction with CO32- to produce HCO3-. The HCO3- produced by Eq. 4 then partly dissociates (Eq. 3), releasing protons and so decreasing the pH-which is where the ‘ocean acidification' actually comes from-but this drop is much smaller than for an un-buffered system. One can also think of the sequence of events resulting from dissolving CO2 in seawater as firstly the production of HCO3- and H+, but because the equilibrium between HCO3- and CO32- (Eq. 3) has now been unbalanced by excess acidity (H+), Eq. 3 goes to the left to consume some of the excess H+, and in doing so, also consumes CO32-.

This is a wonderfully clear explanation of the chemistry of ocean acidification in terms of changing  concentrations or activity of CO2 (atmospheric),  CO2(aqueous), CO3 (carbonate) and bicarbonate (HCO3) ions, as there is later in the article on the negative and positive feedbacks in terms of the capacity of the ocean to absorb CO2 with rising ocean  temperatures.

The proportion of DIC present as CO2 is also affected by temperature, as illustrated in Figure 2. The consequence of this is that, as the ocean warms, less DIC will be partitioned into the form of CO2 (and more as CO32-), hence enhancing the buffering and providing a ‘negative feedback' on rising atmospheric CO2. Here, a feedback describes a mechanism that dimishes or amplifies an initial change and asribed the sign ‘negative' or ‘positive', respectively. For example, melting polar ice caps through global warming will reduce the amount of solar radiation that is reflected back out to space (the Earth's surface becomes less reflective), so producing more warming, which in turn will melt more ice, and so on — a positive feedback. A well-known positive feedback in the carbon cycle arises due to the decrease in solubility of CO2 gas in seawater at higher temperatures. In fact, this greatly outweighs the negative feedback described above, meaning that as the ocean surface warms, even more of the emitted fossil fuel CO2 will remain in the atmosphere.

And how do saturation levels of CO3 in sea water affect the stability of CaCO3 mineral species Aragonite and Calcite which organisms use to build skeletons? What effect will increase in ocean acidification have on organisms? ...

read on.. don't miss out on this chemistry lesson.

Thursday, April 10, 2014

Are Himalayan Glaciers Retreating?

Open Access in Current Science- A remote sensing survey of 2018 glaciers across the Himalayan arc for the time period 2001 -2010 was carried out. Change in snout position was compared. The majority of glaciers over the last ten years show stable snout positions. About 12% show retreat and only 0.9% show advancement. Himalayan glaciers are retreating though. Studies that cover larger time periods have shown that studied glaciers have been in retreat over all of the last century with the largest retreats from the mid 1970's to the late 1990's. Glaciers have been naturally shrinking since the last Ice Age ended with few reversals such as the younger Dryas and the Little Ice Age, but the past 100 years or so are of interest to us due to the impact of anthropogenic global warming.

Glacial retreat may have slowed down in the last decade and no doubt given the complex response of ice masses to their situation in a particular topographic setting and temperature changes such variations in rates of change of glacier decay will continue as the earth warms. Besides, as other water experts have pointed out , the big problem with interpreting the true significance of Himalayan glacier behavior is the lack of crucial baseline data for a) the amount of snowfall in the various Himalayan glacial source areas and b) much of the reporting of changes in glaciers present area changes and not changes in volume. The volume of ice corresponds to the volume of water held, so any assessment of damage to north Indian river supply must study volume change of ice as glacial melt contributes substantially to Himalayan river water flow. Furthermore, such data if it does exist and that collected in the future must be made public to be examined by as many experts as needed and not kept secret as has been the case with Himalayan river water data in the past. So, a lot more work in terms of basic data gathering needs to be done. 

In any case such larger scale studies are useful pointers to regional trends and for pinpointing areas deserving more detailed studies.

Abstract:

The Himalayan mountain system to the north of the Indian land mass with arcuate strike of NW–SE for about 2400 km holds one of the largest concentration of glaciers outside the polar regions in its high-altitude regions. Perennial snow and ice-melt from these frozen reservoirs is used in catchments and alluvial plains of the three major Himalayan river systems, i.e. the Indus, Ganga and Brahmaputra for irrigation, hydropower generation, production of bio-resources and fulfilling the domestic water demand. Also, variations in the extent of these glaciers are understood to be a sensitive indicator of climatic variations of the earth system and might have implications on the availability of water resources in the river systems. Therefore, mapping and monitoring of these fresh  water resources is require d for the planning of water resources and understanding the impact of climatic variations. Thus a study has been carried out to find the change in the extent of Himalayan glaciers during the last decade using IRS LISS III images of 2000 /01/02 and 2010/11. Two thousand and eighteen glaciers representing climatically diverse terrains in the Him a-laya were mapped and monitored. It includes glaciers of Karakoram, Himachal, Zanskar, Uttarakhand, Nepal and Sikkim regions. Among these, 1752 glaciers (86.8%) were observed having stable fronts (no change in the snout position and area of ablation zone), 248 (12.3%) exhibited retreat and 18 (0.9%) of them exhibited advancement of snout. The net loss in 10,250.68 sq km area of the 2018 glaciers put together was found to be 20.94 sq km or 0.2% (2.5 % of 20.94 sq km).