Showing posts with label mapping india. Show all posts

Friday, October 31, 2025

Deccan Traps: Thickness And Elevation

I recently read Peter Brannen’s excellent book “The Ends of the World: Volcanic Apocalypses, Lethal Oceans And Our Quest To Understand Earth's Past Mass Extinctions”. He has packed quite a few details on the geologic triggers and ecologic upheavals the earth has witnessed from time to time, resulting in the episodic reorganization of the earth’s biosphere.

In the chapter on the Late Cretaceous mass extinction he writes, referring to the Deccan Basalts, .. “today in Western India, 11,500 -foot-tall bar-coded mountains, like the jagged banded peaks of Mahabaleshwar have been carved from this surfeit of molten rock”.  He presents a lively discussion on what impact such a prolonged phase of volcanism could have had on environmental health and biodiversity. 

The view below of a section of the Deccan Basalts at Warandha Ghat, SW of Pune city, illustrates nicely the 'bar coded mountains" that Brannen mentions. 


Repeated effusion of lava which spread rapidly away from eruptive vents has produced the distinct layered architecture.  Differential weathering of softer and hard layers produces intermittent rubbly vegetated slopes alternating with scarps resulting in a "bar coded" edifice.

But what about the 11,500 foot tall reference? "Tall" will be read by most as elevation. That is a curious number since the "jagged banded peaks" of the popular hill station of Mahabaleshwar are around 4700 feet high. The highest region in the Deccan Volcanic Province is Kalsubai near Nasik, standing at 5400 feet.

Why such a large discrepancy between Brannen and the measured elevation in the Deccan Volcanic Province? I suspect what Brannen is referring to is a composite stratigraphic thickness of the lava in Western Maharashtra. Refer to the table below. It presents two different approaches to organizing the lava pile into discrete units. 

 Source: Vivek S Kale and coworkers 2017- Geological Society of London, Special Publications. 

"Lithostratigraphy" relies on systematic physical differences in lava packages to classify them into formal units. The "Chemostratigraphy" classification uses chemical differences in successive phases of eruption to subdivided the lava pile. 

Add up the thickness of the individual units and you end up with a 3400 meters or 11,150 feet thick section of lava. Branner may have used a slightly different estimate of lava thickness to arrive at a 11,500 foot thickness for the Deccan Basalts. 

If, as seen in the section at Warandha Ghat, the lava is nearly horizontally disposed, why then is the stack of lava "only" 4700 feet at Mahabaleshwar and caps out at 5400 feet at Kalsubai? 

The answer is in the way the different subunits of the lava are exposed all across the volcanic province. The map below shows sections of the Deccan Traps at different locations.


Source: L Vanderklyusen and coworkers 2011- Journal of Petrology.

In this map, the chemostratigraphic subdivisions are shown. What is important is that all the subunits never stack up in any one place. The reason is in the regional structure of the volcanic pile. It is in the form of a gently waveform with younger packages of lava offlapping towards the south. 


Source: M. Widdowson and K.G. Cox 1996: Earth and Planetary Science Letters.

This north to south cross section of the Deccan Traps along the Western region shows how different subgroups are exposed along the profile. You can see how at any one place the lava thickness and altitude is between 1000 to 1500 meters ASL.

It is important to mention that this is a regional view of the lava section across a distance of around 650 km depicted with a 40x vertical exaggeration.  The inclination of the lava layers is very subtle and has been deduced from careful measurements of the altitude of the subunit boundaries at different locations along the profile. 

The section below shows a close up of the lava stratigraphy along two north to south profiles in mid Western Maharashtra in the well known Harishchandragarh - Bhimashankar area. Notice again how only a few of the units stack in any one location.  


Source: Vivek S Kale and coworkers 2017- Geological Society of London, Special Publications.

Why did such an arrangement of the lava units emerge? Is the waveform a regional volcanic dome with lava radiating from one central eruptive center? Or is it due to post-eruption arching of the crust? Have younger lava sections been removed by erosion from the northerly locales, or has there been a southerly migration of eruptive centers over time, resulting in the offlapping arrangement? Anne E. Jay and Mike Widdowson in a study published in the Geological Society of London estimate that as much as 1.5 km of lava section has been removed by erosion from the Nasik area. That region would have stood much taller tens of millions of years ago. We will leave these questions lingering for another time. 

What I do wish is that Mahabaleshwar really stood 11,500 feet tall. I could have ice skated on Lake Venna. 

Saturday, October 9, 2021

Maps: India Contours

Once in a while I point readers to interesting and useful web mapping applications. Last week, Raj Bhagat Palanichamy, a specialist in GIS and Remote Sensing,  showcased a contour map on his Twitter feed. Intrigued, I found out that the contour map was from a web based application developed by Axis Maps. A detailed blog post explains how they developed the application and the elevation data sources they used to generate the contours. It is quite easy to use, with some controls to set contour intervals, line color, and to depict relief in color shades. 

I am putting a few examples from different Indian terrains to showcase this utility. It is not meant to be a critical review of the app (map scale is missing!), but a fun exploration of its capabilities, and the insights one can get about topography and other aspects of geomorphology and geology. Each example has a contour map on top and a satellite image of roughly the same area in the lower panel. All contours maps have been created using Contours- Axis Maps.

Western Ghats- Edge of the Deccan Plateau: Ghangad, Tail Baila Mesas

The edge of the Deccan Plateau has been deeply dissected to form some stunning relief. Steep sided ridges, mesas, and pinnacles poke upwards from more gently sloping and flattish surfaces. This step like appearance occurs due to the differing styles in which lava flows of varying hardness weather and erode away.  Towards the left-center of the contour map, where the brown meets the darker green, is what appears to be a sinuous thick brown line. It is really an amalgamation of contours, spaced closely, due to the extremely steep slopes and cliffs that make up the Western Ghat escarpment. There is a sudden fall there from the plateau to the coastal plain. Contour interval is 100 feet. 

Himalaya-Tibetan Plateau


Notice how the closely spaced contours in the lower left of the contour map give way to more openly spaced contours towards the top right of the map. This is the transition from the Gharwal Himalaya in to the Tibetan Plateau. The Himalaya, because it receives more rainfall, has more prominent relief, formed by rivers carving deep valleys, and glaciers gouging out rock faces into steep sided, sharp edged mountains. The Tibetan Plateau, although also standing high at around 4500 meters, is in the rain shadow region. It shows less relief. 

This has impacted the geology too. In the Himalaya, the rapid stripping of rock cover over millions of years has exhumed rocks which were once buried 25 kilometers below the surface. In Tibet, lesser erosion has meant that the surface geology is still dominated by 'supracrustal rocks', either volcanic or sedimentary rocks formed at shallow levels of the crust. Erosion has not dug deep down. Contour interval is 500 feet.

Nallamalai Fold Belt- Andhra Pradesh


This map shows the folded ridges of sedimentary rocks formed in the Cuddapah Basin around 1500-1600 million years ago. A fine example of topographic expression giving away the geologic structure of the rocks. Contour interval is 200 feet. 

I would urge those readers who are on Twitter to follow Raj Bhagat Palanichamy's excellent account (@rajbhagatt). He is a mapper par excellence.

Tuesday, March 4, 2014

Conversation With An Ex Geological Survey Of India Geologist

This is the first of what is hopefully a series of posts with my Pune based geology friends. Indian scientists don't talk enough with the public. We see them only on "Science Day" at various institutions or at major events like satellite launches, nuclear protests and earthquakes. But a more frequent conversation with the public conveying the joys and challenges of a science career is missing. Most scientists don't make momentous discoveries. They spend their careers framing smaller manageable questions and attempt to find answers for them. This process of science and small victories is revealing and inspiring too. So these "conversations over coffee" posts are an attempt to highlight the work of my geology colleagues and friends presented in a more informal casual form and made more accessible via social media.

In this conversation I talk with Dr. Sudha Vaddadi (above left having a coffee with me "The Fractured Geologist") who after a two decade distinguished career with the Geological Survey of India (GSI) is now visiting faculty at Fergusson College, Pune. We talk about her PhD research, mapping the complex Deccan lava flows, lack of direct recruitment in the GSI and resulting career stagnation, teaching stratigraphy and the need for more quantitative methods in Master's degree programs, working as the only woman in the GSI office, and waiting long hours in the field  for bullocks to pull a broken down jeep to the nearest garage.

Our conversation and email question and answers took place from late January through the month of February. The only changes I have made to the email interview document is to add a few hyperlinks.

[modified on March 5th- changed the order of the questions, brought the question about GSI recruitment to the top]

Monday, April 8, 2013

Paranoia Over Google Mapping Tools Persists In Indian Officialdom

sigh... I keep writing about this only partly as comedy.. but mostly in frustration...

From an article in the Hindu about the recently held "mapathon"contest organized by Google.

As Delhi Police investigates whether Google violated rules in holding a competition that asked users to add information about their local areas for its online map, the U.S. Internet giant on Saturday said it had responded to queries raised by Survey of India more than 10 days back and hasn’t heard from it yet. (emphasis mine)

Apparently, the Survey of India and the Defence establishment is worried that such initiatives will have grave security repercussions.  The problem is that Google has been asking users to add information about their local areas for its online map for several years now. I just don't comprehend how a mapping contest wherein lots of enthusiasts add places of interest on a map within a short span of time becomes a greater security threat than an individual using Google Maps on any other day of the year.

more from this article in the Economic Times... But on behalf of the Surveyor General of India Swarna Subba Rao, his deputy major general R C Padhi told the three ministries that Mapathon was "not in accordance with the national Mapping Policy 2005 and map restriction policies issued by the defence ministry from time to time", sources said.

Added a senior defence officer, "Such activities can have serious security repercussions in case mapping of restricted areas is undertaken by members of the general public."

The words "general public" come out of the mouths of our officials with such contempt and suspicion. These archaic mapping policies which restrict the "general public" from mapping certain areas have long been rendered meaningless by the many roving eyes that hover above the earth. I am sure the government understands this.. but relinquishing control over anything has always been hard for Indian officialdom.

The exceedingly vast majority of people using Google applications to map India don't want to harm India.

Those who do... might I remind the Indian Government that the terrorists who attacked Mumbai on November 26 2008 did not wait for a mapping contest to survey the city.

Thursday, October 6, 2011

Online Interactive Geological Map Of India

I keep tabs on the India Biodiversity Portal, one of the best India based open access web mapping applications focusing on natural resources.

They have online now an interactive geological layer created by digitizing likely 1 : 1 million scale Geological Survey Of India geology maps. The contributor is R. Ravindranath of the Foundation of Ecological Security. You can click on geological units and get a description of the unit. You can also thematically style the geology based on Geological Age and Lithology. And you can control transparency so as to get an idea of the relationship between say physiography and geology. The physiography layer is one of the Google base layers available for display.


Other geology related overlay layers are India Aquifers, India Soils, India Geomorphology and India River Basins. I wish they had different display styles like transparent cross hatch, dots, symbols and lines and so on to choose from to enable easy visualization of multiple themes but perhaps that is something for the future. Unfortunately none of these geology layers are available as downloads. Government owned vector data is still not being distributed freely in digital format. I hope there is a change in policy on that soon.

But this is an important and growing resource for geology and biodiversity data. You can register and contribute layers to the natural resources database. Most Layers not under government control are downloadable (as shape files, GML and text) but contributors are free to choose the level of restrictions they want under a Creative Commons license.

Saturday, July 2, 2011

Mapping India: Another National GIS Effort Launched

From a trickle to a flood; the number of government backed initiatives to develop map based applications intended to reach and involve citizens to help manage India's natural and urban resources have increased over the last decade.

The latest as reported by the Economic Times is the National GIS, what appears to be a massive effort to standardize available spatial data and build resource management applications, served out over the web to different users.

I don't have enough details to comment on the particulars, but some thoughts -

The effort is touted as something of a brand new venture, although I suspect that existing applications and ongoing efforts will be grafted onto this new entity. For example, Bhoosampada (new link) allows users to browse and search for landuse and landcover data. And the National Urban GIS Mapping Mission which has promised to build standardized urban data sets is supposed to be underway to map urban areas and develop applications to aid urban governance.

My hope is that the new National GIS is not a massive duplication of efforts and that these older intiatives with some improvements will be brought within a wider umbrella effort.

There is going to a citizen layer in this application which will allow citizens to geo-tag their complaints. The principle is admirable but better governance is more hostage to a mindset than it is to technology. Today, I can either email or call or put up a status on the Pune Municipal Corporation or Pune Traffic Facebook page about a particular grievience, but the response rate is abysmal. Unless a method of personal accountability is tied up with the complaint workflow, I don't see how the citizen layer will lead to a better government -citizen partnership.

Still, it is something of a wonder that more and more government data locked up previously is making its way into the public domain. ...slowly..but that counts for progress nevertheless.

Monday, October 4, 2010

A New Version Of Bhuvan Has Been Released

The Indian Space Research Organization has released a new beta version of Bhuvan a web mapping tool which serves images of India and the rest of the world taken from various Indian remote sensing satellites. It is available in 2D and 3D versions.

The new versions looks a little slicker and cleaner than its predecessor. But 5.8 meters is the highest resolution imagery available via Bhuvan while Google Maps and Google Earth both have long started serving 1 meter or so images of Indian cities and hinterland.

In case you are wondering why, here is the Remote Sensing data policy of the Government of India:

Government prescribes the following guidelines to be adopted for dissemination of satellite remote sensing data in India:

All data of resolutions up to 5.8 m shall be distributed on a nondiscriminatory basis and on “as requested basis”.

With a view to protect national security interests, all data of 5.8 m and better than 5.8 m resolution images will be screened by the appropriate agency before distribution so that images of sensitive areas are excluded.
           
a. Data of 5.8m and up to 1m resolution can be distributed to users after screening and ensuring that the sensitive areas are excluded.

b. Data of 1m resolution and better will also be screened as above and the following procedure will be followed for its distribution.
                 
i. Government users can obtain the data without any further clearance.
                
ii. Private sector agencies, recommended by at least one Government agency for use of 1 m and better resolution data for supporting development activities, can obtain it without any further clearance.
                
iii. Private, foreign and other users can obtain the data after further clearance from an inter-agency High Resolution Image Clearance Committee (HRC).
                 
iv. Specific requests for data of sensitive areas, by any user, can be distributed only after obtaining clearance from HRC.
                
v. Specific sale/non-disclosure agreements to be concluded between NRSC and users for data of 1 m resolution and better.

What this means is that under the current policy scenario, high resolution (1 meter or so) images collected from Indian satellites will not be available via open access free web mapping tools like Bhuvan. The only users of this high res imagery will be those who have obtained clearances for images of pre-defined geographic extent to be viewed in specialized GIS and Remote Sensing software.

This will severely limit the user base of Bhuvan and Indian imagery:

For example-

1) That means despite a developer API for Bhuvan being available there will likely be few takers especially for designers of urban applications.

2) And Bhuvan for the mobile market?... all those location apps, business listings, navigation already available via Google..?... forget it.. can't be done when your street and neighborhood looks like an undifferentiated granular blob.

3) Additional India specific thematic layers..?... many already  available at other free web mapping apps like Geocommons, India Biodiversity PortalBhoosampada, and  Census India Web Mapping.

unless there is a policy shift with regards to availability of high resolution images... I don't see the point of Bhuvan..

Wednesday, February 24, 2010

Mapping India: Can The RTI Be Extended To The NSDI

A clarion call seems to have been issued by the high priests of Indian government spatial data--

Resistance is futile...join the collective.

The Borg in this case is the National Spatial Data Infrastructure (NSDI), an ambitious, much needed, slowly being built but yet to be fully realized vision to enable easy open and quick access to public domain spatial data.

The latest  to join this collective is another web mapping application, this time developed by the Central Ground Water Board. I began this post wanting to review it, but found it agonizingly slow the few times I tried to use it.

Instead I started thinking about the NSDI and what it could potentially do to facilitate a better engagement of civil society with government...more specifically..

can the mechanism of acquiring information through the Right To Information Act (RTI) be extended and modified to these web mapping applications under the umbrella of the NSDI?

Traditionally users of spatial information in India fall into two extreme categories. There are those "lightweight" users who go on the excellent mapping services of Google, Yahoo..so on and use the images to locate items of interest, find directions, distances and create custom maps by putting placemarks and routes. The image quality is excellent but the apps have no serious analytical capability.

At the other pole are "serious" GIS users who access spatial data from heavyweight GIS and image processing packages with extended analytical and mapping capabilities. These users are spatial data professionals working in both the public and private sector.

The NSDI will create a third kind of a user....someone who may not formally work in GIS, may not have access to or afford access to a GIS, but nevertheless may want access to spatial data and may want to ask sophisticated spatial questions. The web mapping applications that owners of public domain spatial data must create, will provide a gateway to such user aspirations.

This opens up exciting possibilities for civic groups, NGO's and curious citizens..the third user group.. so to speak, who want to examine and question government on the status of natural resources, urban planning and developmental projects..all areas where spatial reasoning is critical.

Entering a web mapping app via the NSDI it would be possible for example to ask:

1) For a particular area..show me the locations of ground water wells with contaminants above a specified quantity, within a specified distance of a known point pollution source...potentially through the CGWB web app

2)  For Ward X of city Y...prepare a map of lakes and streams and encroachments within these green zones...potentially through the Urban Mapping Mission websites.

3) ...For district X prepare a map of forest land with various levels of legal protection and the location of planned developmental projects within and near these forests...potentially through the Ministry of Environment and Forest website.

There will be some limitations to this kind of approach to information access:

1) The type of information a user may want is not included as a spatial layer in that particular web app.

2) The web app is not equipped with a query engine capable of performing the analysis.

3) The user knows what (s)he wants but does not have the expertise to perform the analysis.

4) The query might encompass a very large area and might run into bandwidth and application performance issues.

..so..  why not bypass these limitations which are sure to crop up and enable the user via the mapping application to compose a question, not using the formal query engine but ...in plain language like the ones above... and send them to a designated Spatial Information Officer. That officer - and each public domain web mapping application will have one -  will process the query using a GIS and if required gather information from other sources and send the compiled answer within a specified time line.

The answers would be sent as a map in an image format and associated attribute data could be sent as an excel or a database file. Administrative costs can be charged through online credit card payments or can be sent via a check.

In effect the RTI will be extended to include these public domain web mapping sites as an official application counter for information. 

At present the NSDI and each of the associated agencies do have an RTI officer. But you have to apply to a central office for information. That central office may not have developed the needed synergy and cooperation with its GIS office to efficiently process your query.

I am thinking in terms of a decentralized mechanism wherein queries are sent directly through individual web mapping applications to the spatial information officer in charge of that application and answers to these queries are generated by processing the spatial databases underlying the web mapping app.

I have a feeling that something along these line must be put in place if the NSDI wants to fulfill its promise of open access to data. The first few web mapping sites I have come across do not have truly dynamic query engines that would enable a user to perform sophisticated analysis. Besides, the government may choose to present the pubic with only a limited view of the total data set.

Placing these web mapping sites within the ambit of the RTI would mean that all the information sitting in the underlying databases and not just the subset view presented via the mapping applications will be open to and can be accessed by the public.

Moreover, the spatial layers and associated databases if correctly attributed and structured,  will give results to queries potentially within a few minutes.  So this method will have a huge advantage over a traditional RTI query, the answer to which will have to put together painstakingly from disparate files  which may not yield very well to spatial queries.

Mapping applications under the NSDI will allow citizens to view, browse and query public domain data with a geographic context. Sorting through data this way..thinking of spatial relationships between objects... may inspire citizens to think of new questions to ask and in to new ways of analyzing information. A more productive and open relationship between citizen and government can be forged if the NSDI opens up to these possibilities.

See: Mapping India

Monday, November 30, 2009

Mapping India: Land Degradation and Desertification

In the November 25 issue of Current Science, researchers from the Indian Space Research Organization release a map and some important estimates of the extent of land degradation and desertification affecting mainly dry, semi-arid and dry- sub humid areas of India.


Source: Desertification/land degradation status mapping of India

About 69% of the total land area of the country - about 228 million hectares - falls in one of these three climatic categories. The numbers from this mapping project is cause for concern. They indicate that land degradation has affected just under half the extent - 105 million hectares of these dryland regions,  roughly 32% of the land area of India.

The main processes of degradation are water erosion, wind erosion and vegetal degradation through deforestation and overgrazing. The paper gives the extents affected by various degradation processes grouped state-wise.

I wish they had included estimates of degradation by land use. For example how much of agricultural land in each state is being degraded, how much forest and so on. These have been no doubt calculated. They show up as classes on the map, but the paper does not present the results by type of land use affected.

If predictions about changing rainfall patterns over India because of climate change turn out to be accurate they will accentuate many of these degradation processes. Rainfall is predicted to fall in shorter more intense bursts over many regions of India. This would mean more powerful surface runoff and greater soil erosion.

Regions of country which are hot and arid like Gujarat and Rajasthan are likely to get hotter and drier. That would mean more stress on vegetation and great wind erosion.

I come back to the National Action Plan For Climate Change (15 MB) There are 8 missions or strategies to deal with climate change. None of these directly includes the problem of land degradation and desertification in dryland regions. However the National Water Mission, National Mission for a Green India and the National Mission for Sustainable Agriculture seem to have the right overlapping goals that could be focused to address this problem.

I mentioned earlier about the estimates of land degradation according to land use. These numbers matter a lot. Farmers occupying dryland regions are usually poor farmers cultivating marginal lands. If you look at the above map, you will see large regions classified as Agriculture Unirrigated being affected by various processes of land degradation. These are farmlands that are out of the reach of irrigation canals and other State largesse.  Millions of farmers cultivate small land holdings, depending only on monsoons and groundwater. Warming and changing rainfall patterns will have a larger impact on these marginal farmers. Their livelihoods and the food security for large number of people in these drylands is at risk from continuing damage to the land.

The National Action Plan For Climate Change needs to single them out for special help.

Monday, August 17, 2009

Indian Space Org's First Release Bhuvan Is A Dud

The Indian Space Research Organization just doesn't get it does it?
If it aspires to be player in the innovative and fast evolving world of web mapping applications, then a product launch that got so much pre -launch publicity needs to have a serious wow factor to it. It must shake up old and new users.

Agreed you may not have all the data and all the planned functionality ready but what you present to your audience should at least have the appearance of completeness. You should put out whatever best data you have and make sure all the tools and functions are in working order. Beta release and future potential are all well accepted processes and norms within the software industry, but web map users who have over the last few years become fat on a diet of elegant and increasingly sophisticated products are going to be making a spot judgment on what you have now.
And for this first release of Bhuvan that means ....not much.
But I am getting ahead of myself. Ambuj Saxena beat me to it. He blogs at Devils Workshop and has a nice post on his experience with Bhuvan. I concur with many of his criticisms that Bhuvan has been hastily put together and users are going to get annoyed that it just doesn't stand up to its pre launch hype in terms of image quality and other functionality.
Albeit critical Devangshu Datta in an article on Bhuvan in the Business Standard takes a mellower and longer view and points to the potential of a product like this. I am more apprehensive for reasons I will elaborate later and I feel most users who want an immediate rich and inspiring experience will need some persuasion that Bhuvan can be significantly improved upon.
I just want to go through the four points I had raised in my speculative preview of Bhuvan and then add more thoughts on some of the details of the product and user experience.
1) Will the images from Bhuvan be superior to that provided by Google? - It is going to be a crushing blow to users who having followed the pre- launch announcements would have gone on Bhuvan expecting high resolution images of their cities and homes. ISRO decided to keep its best data away and instead serve up coarser data from its Linear Imaging Self Scanner (LISS) LISS 3 and LiSS 4 sensors aboard its IRS satellite series. That means a resolution ranging from about 24 meters to about 5 meters. ISRO has better data than this. Its Cartosat 1 satellite has been imaging India for the last 4 years and Cartosat 2 for the last one year. That data is 2.5 meters and 0.8 meters resolution resp. The quicker that comes online the better.

Right now Google products win hands down.

The image clarity issue has been a fiasco for ISRO. For months the media excitedly wrote that Bhuvan will be offering images much better than Google. ISRO kept silent and did not issue much needed correctives, thereby implicitly supporting the tripe the media was offering. Then after all this they go and offer us second level imagery. Its enough to turn away potential users in disgust.
2) Will ISRO make other data available? - Yes, Bhuvan has administrative data like state, district and tehsil boundaries, transportation data like national highways and natural resources data like rivers, water bodies, wasteland, and soil. A limited selection but more might be on the way. I have more to say about data later in this post.
3) Will Bhuvan be like Google Maps or like Google Earth? - There was conflicting information on this. The indications were that Bhuvan might be like Google Maps, meaning a true web enabled mapping service. I guessed wrong in an earlier post. ISRO has decided to engineer it more like Google Earth. That means you have to download software. Bhuvan is a local application which gets only images from a remote server. Otherwise the application interface, all the menus, tools and other functionality is being served from your hard drive. This does make the interface more efficient and quick. I've heard quibbles about the 10 Mb download. But I would rather suffer a onetime download and then work with a fast interface than perpetually get frustrated waiting for the entire interface being served over a limited bandwidth.
The less known fact is that the 3D capabilities of Bhuvan, i.e. the app that lets us drape and visualize images in a 3D environment is actually being run from a tool called Terra Explorer a 3D environment geospatial application specialist owned by Skyline. ISRO has licensed Terra Explorer to serve as a foundation for Bhuvan. The rest of Bhuvan functionality is built on top of this Terra Explorer core.
I could not find this information anywhere in the documentation on their website. Ambuj mentioned this in his post. Curiously when I was playing around installing and uninstalling Bhuvan I got a notification .......Terra Explorer uninstalled!
I just had to laugh. So much for the chest beating and boasting that Bhuvan is an indigenous alternative to Google Earth.
4) Will ISRO allow open access to the Bhuvan API? - No indication that ISRO is going to allow an open API for customizing this product. This is a real pity. It will severely limit use of this product as innovators will flock to applications like Google Maps to create complex applications and mashups which means less use of ISRO imagery and data.
ISRO in fact may not be able to open up its API even if it wanted to because that may violate its licensing agreement with Terra Explorer.
On to some other concerns I have about Bhuvan -
a) Performance optimization for Indian users- Google Earth has a great feature. You can work offline. When you first go online and call up images for a certain area, those images at the zoom extent you have seeing them are stored in cache. You can go offline and work with those images from cache. You can't obviously call up any new images but if you are doing concentrated work on only one area you can work offline. ISRO missed out on this feature. Since the software resides on your computer working offline would have been a boon in Indian conditions where connectivity is erratic and where lots of users buy limited download packages from their ISP.
b) Elements of cartography, map layer control , aesthetics- Can we have a visual display of map layers that looks a bit professional please? As of now the most elementary principles of cartography and map layer control are missing. For example the icon for city is the default pin! And it doesn't scale to zoom extent. Boundaries and roads are not displayed with proper line thicknesses and polygon color fills can't be seen. Labels likewise don't scale and are garishly colored. ISRO needs to hire professional map makers and designers to work on this one.
c) Who is Bhuvan aimed at? I am becoming more puzzled by the question of which user community ISRO is trying to target. The fastest growing user base for mapping applications in India are people interested in urban location based apps. But ISRO has effectively shut itself from this potential user base. Currently the images are just too coarse for any meaningful urban visualization and analysis. Getting Cartosat 2 images online will bring images comparable to Google Maps within reach of Indian users.
But a deeper problem awaits. I suspect the Indian government does not have ownership of annotated detailed street maps and city feature layers. Over the years Urban GIS has been neglected by the government. The detailed street maps and annotations you see in apps like Google Maps for Indian cities have been collected by private players and have been licensed to Google. The government sees the need for detailed urban datasets and has launched the Urban Mapping Mission. But it may be years before the mission produces data and Bhuvan gets detailed street maps owned by the government.
The immediate option would be to license street maps from private owners but I doubt they will do that. And again even having detailed street maps will be of limited use to users and developers if they don't have an open API to build value added services on top of this base data.
Which leaves Bhuvan with users interested in natural resources.
d) Will even good natural resources data save Bhuvan? This is the one area where Bhuvan is claiming a clear advantage over Google products and services i.e. availability of Indian natural resources data sets. With this release rivers, wasteland and soil data layers are available for information retrieval. But again I have doubts. They layers are not exclusively found in Bhuvan. For example the elegantly designed India Biodiversity Portal already has several natural resources data sets online which overlap with what Bhuvan is offering. Another government venture Bhoosampada offers land use and land cover data from which you can extract wasteland info again overlapping with Bhuvan.
So I am not sure if Bhuvan can maintain a clear advantage over other services even in natural resources datasets. This problem will get exacerbated when the National Spatial Data Infrastructure brings even more datasets onto the public domain. Non government / private organizations are sure to mine them to create innovative products.
My fear is Bhuvan given the stuttering incremental way in which government works will always be lagging behind.
In summary for your India data needs:
For best imagery- Google Earth / Google Maps
For Urban Data Needs - Google Maps
For Natural Resources Data Needs - India Biodiversity Portal, Bhoosampada, Bhuvan
Also check out GeoCommons for India Census data. Its is another upcoming public domain mapping platform with improving India data sets.
A Beta release does not mean releasing a product which is virtually useless. And given the web mapping ecosystem in which Bhuvan is competing this product is incomplete to the point of being useless. It will certainly evolve and improve in the future and offer a specialized group of users an information retrieval and sharing system for natural resources and village level data but so will other products offering similar services and data sets. I don't see a broad user base for this application.

Monday, August 10, 2009

Arunachal Pradesh With Chinese Place Names

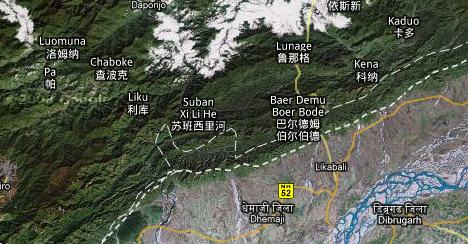
Ogle Earth has a nice write up on the recent mistake by Google Maps of placing Chinese place names on areas of Arunachal Pradesh. This is administered by India although China disputes India's authority over this region. The dotted white lines in the image below is the disputed Chinese version of political geography. Notice place names north of the white line (boundary between Assam and Arunachal Pradesh) are in Chinese, while those south of the line are in Hindi.


Source: Ogle Earth
Go read the article. It gives you a good idea about Google's policy regarding depiction of disputed border claims and the strange consequence of depicting different world borders depending upon which countries web servers the maps are being distributed from.

Wednesday, August 5, 2009

I Finally Downloaded Aster 30 M Elevation Data

30 meter elevation data set for India, part of a global data set from the Advanced Spaceborne Thermal Emission and Reflection Radiometer (ASTER) is available for download free of charge from the NASA's Land Process Distributed Active Archive Centre.

The ASTER instrument has a steroscopic imaging capability in the near-infrared band. The elevation data is extracted from this stereo-data by auto-stereocorrelation of nadir (directly below ortho view)) and along-track oblique view of the ASTER sensors.

The data is partitioned into 1 deg by 1 deg tiles. So instead of downloading just one massive file you can download data in small chunks of about 8 Mb -12 Mb size. The download is a zip file. That's really convenient for users with slowish connections. The DEM upon extract is about 24 Mb. The download process requires a little patience. It has plenty of little intermediate steps you have to complete before the final order form is submitted. At the end of the process you will be emailed a ftp URL. You can pull your selected data set from that ftp folder. Do study the download tutorial before proceeding.

I got to know of it a few weeks back from a GIS forum I follow. Yesterday night I finally decided to test the download process. Within an hour I had registered an account , made my selection and downloaded elevation data for the region around Pune, India. See the image below. I imported the DEM in Manifold GIS and created a quick display. I have shown 2 tiles, only part of the data I downloaded. The upper tile is shown in a gray palette and the lower in a standard altitude palette. I have overlain a 0.5 deg graticule grid for reference.


Free data is always good news. Users though have to be careful when applying ASTER data for their various needs. ASTER is a relative DEM which means that the elevation data has been constructed entirely using the stereo-images with no corrections applied using ground control points. The positional accuracy and the feature integrity is determined by the knowledge of sensor parameters and shape of the geoid. Accuracy assessment of the ASTER product by comparing it with other DEM and ground control points suggests overall horizontal and vertical accuracy of about 20 m but may be worse locally. Topographic artifacts and inaccuracies in feature geometry also exist. Also although the elevations are posted at 30 m interval the details of topographic features that can be resolved appears to be about 100 m or so.

You can improve on ASTER data by reconstructing the DEM by inputting additional elevation information from ground control points in a competent raster processing software. But the raw data will have inaccuracies and so is not a good bet for any detailed work that needs highly accurate terrain information. Good enough to use as a backdrop and for reconnaissance and preliminary research purposes.

The image below is a close up of the West India coastal plains leading up eastwards to the western ghat escarpment (the sharp contrast between the light green and the dark green) and part of the plateau.


This is a welcome addition to the list of spatial data for India. A 30 arc second or 1 km resolution DEM is available for download free of charge from the USGS. You can also order elevation data for India from the Environment Information Centre, a Ministry of Env. and Forest data warehouse. This terrain model is extracted from source topographic maps of 1:50,000 scale and will have more positional accuracy and feature integrity than the raw ASTER output although it will be likely of coarser resolution. You will have to pay for this data set; about Rs 12,000 ($ 250/-) for every 100 sq km. A 30 m resolution data set (100 m in practice) improves on these older data sets in terms of resolution but not necessarily in terms of the accuracy.

NASA has indicated that this is the first release and improvements to this data set will follow in the future.

You can download data from this NASA data distribution site. There is a mirror site in Japan too.

Thursday, July 23, 2009

Mapping India: National Urban GIS

This project initiated by the Central Government to create a city level Geographic Information Systems (GIS) database for 152 cities and towns all over India has a lot of merit. If implemented to its full potential by individual cities, it could knock some sense in the day to day governance of Indian cities and help prepare for their planned growth.

GIS for urban applications has lagged behind GIS for natural resource application in India. There are probably many reasons for this. Institutional inertia, lack of awareness, inadequate city budgets and the high expense of creating detailed spatial datasets; all these or different combinations of these factors in different cities have prevented GIS from playing a constructive role in city planning.

The National Urban Mapping Mission looks to change all this. Funding for developing 1:10,000 and 1:2000 scale spatial datasets will be provided by the Central Government (75%) and the State Government (25%). The Survey of India which is the National Mapping agency will take charge of data creation. There will be deadlines, timelines, capacity building , performance measures... all the corporate buzzwords for successful project management are being pressed into service. The end result will be seamless city level spatial datasets, all relevant information needed to run the city just a mouse click away.

I'm excited about this mission. The experience of using GIS for city planning in Pune where I live has been to put it mildly ... disappointing. There have been various half hearted attempts to use the technology, but the mentality has been to use it to solve isolated problems. There hasn't been a concerted effort to create an integrated city level system which brings together data from various departments and then crucially to embed this GIS in the day to day work schedule of the city government.

And it is the way in which individual cities respond to this initiative that offers the greatest potential for success but also possible stumbling blocks to its effective implementation. Despite this impressive start I have to express my concerns over the long term viability of the National Urban Mapping Mission. I looked through the roadmap document available through their website. It is impressive. There is no question that the Survey of India is a reputable organization and a high quality database will be developed by them. Also importantly there is money set aside for capacity building. Each city will send a few officials to get trained in GIS.

What I want to know is whether individual cities will set aside money from its budget to fund a full time specialist staff to manage this GIS. Over the long term the responsibility of maintaining this GIS will have to come from within the city government budget. The Centre and State are unlikely to contribute any money towards hiring staff and other such sundry city governance matters. So far the way to avoid hiring additional staff has been to delegate GIS as an additional responsibility to city engineers and planners who have ten other matters to attend to.

This could work in the past because GIS played a minor role if at all in city planning. But if these soon to be available new massive datasets and attending software and hardware are to be looked after properly and used to their fullest potential, then specialists will need to be hired full time. Surrogates who will be spending most of the day in their primary job as a city engineer or planner or administrator simply won't be able to act as GIS gurus as well.

I have come across this situation before with the Maharashtra Forest Service. A few years back I had a conversation about GIS with a forest officer. He was frustrated that after spending tens of thousand of dollars on GIS software, the Maharashtra Government made no provision to hire specialists to run it! Instead Forest Officers were sent for training. Now, these are smart officers but their primary duty was to tour the district, make working plans for forest management and attend to other administrative tasks. They had no time left over for GIS work.

This Urban Mapping Mission has been to some extent forced upon cities by the Central Government. But such a top down approach is handicapped by the fact that the Central Government doesn't run the cities. The success of this mission will depend upon whether individual city governments allocate sufficient funding to and allow GIS to play a central and integrative role in the process of city management and planning. Many cities have created good development plans for growth without the use of GIS over the years. But political interference and pressure from the urban builder lobby has seen those plans fail. Technology by itself will not fix the misgovernance of Indian cities. Using GIS effectively means a change in mindset first. Given the chaotic and corrupt history of functioning of Indian city governments there is reason for some pessimism here.

The second question I had was about citizen access to all this data. Will these datasets eventually become part of the National Spatial Data Infrastructure? Will they be available to citizens for download (don't mind paying for them, I am not asking for free data, just easy access to it) thus enabling value additions that will encourage a thousand spin off applications to emerge?

That would be the forward looking and mature position to take. I hope our government thinks the same.

Tip: Spatial Sustain

Monday, July 13, 2009

Multitasking In 1800's India

I had to share this.

I am reading The Ruling Caste: Imperial Lives in the Victorian Raj by David Gilmour. It's an account of the day to day lives of British Civil Servants as they went about their administrative duties in 1800's India. The District Collector was one of the key positions - as it is today- and the Collector besides his responsibility as a revenue officer was also a Magistrate who heard cases and imposed fines up to Rs 1000/- and sentences of up to 2 years:

The Collector and the Magistrate had many different functions, but for his main two he also possessed different personas. He had separate offices for them , staffed by separate sets of clerks who enjoyed acrimonious correspondence with each other. One District Officer "used to find drafts of letters from myself as Magistrate to myself as Collector accusing myself of neglect and delay, and some very trenchant replies placed before me for signature".

Among the many responsibilities and expertise the Collector had to acquire was an ability to understand landscapes and read maps. Assessing property holdings and estimating tax was a tricky task and the land holdings were drawn on enormous pieces of linen with parcels shown at a scale 1 mile to 63 inches! That means over 5 feet of cloth was used to depict one mile of the earth.

These were local maps covering only one village and surrounding area and showing only property holdings. A much larger mapping effort to produce a seamless tapestry of the Indian landscape- also initiated by British geologists and surveyors- was going on in the 1800's, one that very carefully was measuring the lay of the land and producing a triangulation network which later survey projects used as the basis for generating topographic maps on a scale of 1 inch to 1 mile. That effort is described in The Great Arc by John Keay. It is an absorbing and startling account of a mapping project that lasted half a century and produced the baseline landscape information that were then used for additional survey, building roads, canals and railways.

Indians reading the Ruling Caste might feel that the book is perhaps too sympathetic towards the officers of the Civil Service. They were after all men carrying out the orders of a colonial exploitative regime. But the job was a genuinely tough one. A person with no experience of India at age 23 was suddenly given charge of as many as 2 million people. An Officer could be stuck at a remote station with no correspondence with headquarters for weeks. Decisions had to be made on the spot that could influence the lives of thousands.

The Civil officers or "Civilians" were always outsiders amongst what seemed a strange and bewildering people, yearning for "Home" and waiting eagerly for Furlough ( a two year sabbatical in England). But tragically they were strangers too when they went back to England on retirement. Most of them missed India on their return to England, missed the outdoor life and the responsibilty of office and the servants- in-waiting. And after a 30 year career they found that people in England regarded them to be bores too eager to tell India stories and completely out of touch with contemporary England society.

Rudyard Kipling famous for his evocative descriptions of the Raj despaired on being confronted with the dreary London sky-

It's Oh to see the morn ablaze
Above the mango-tope
When homeward through the dewy cane
The little jackels lope.
And half Bengal heaves into view,
New-washed - with sunlight soap.

If you read this book as a human interest story you will find it rewarding.

See: My Book Shelf

Friday, May 1, 2009

Land Use Web Maps Through Bhoosampada; I Hope Bhuvan Is Not Like This

My post series on GIS web mapping applications for users to view, browse and query Indian spatial datasets continues. This post is on an application that allows users to view and get information about the land use and land cover of India.

Bhoosampada is the name of the application (it means earth's bounty, a reference to natural resources of India) developed under the aegis of the National Remote Sensing Centre, Hyderabad, India. Other Indian space organizations based in Dehradun, Jaipur and Bangalore have contributed to this project. It promises the user a rapid assessment of national level land use and land cover.

Right on! Entry to the application was surprisingly quick. I had to register, but the response was automated and I got my user name and password validated in a jiffy. I had given my India address. I would love to see someone from outside India try to register as a check on whether that causes the "security issues" mandarins any heartaches. If anyone has tried it do let me know.

Anyways below is the application interface.


It's a standard web mapping interface. The default view is an outline of India with the land use and land cover (LULC) overlaid. You can zoom and pan using the tools or zoom to a predetermined scale using the scale tool. The choice is from 1:1 million to 1: 200,000. Not that great I know! But apparently this is a National level LULC mapping effort that will be done on a yearly basis on a 1:250,000 scale. So for the time being users have to deal with a somewhat coarse dataset.

The LULC classes have been derived using a classification scheme on imagery from the IRS-P6 or Resourcesat-I satellite's Advanced Wide Field Sensor (AWiFS) with additional imagery input from earlier IRS series sensors. The pixel resolution is 56 m. The NRSA project manual describes in detail all the satellite image processing and classification methodology along with metadata standards.

In the layer list there are two types of layers. Those that can be queried and those that are only for display. Layers only for display are the LULC classes, water bodies and snow cover. Layers that can be queried are administrative boundaries- State, District, Taluka, District Headquarters and Major Towns.

Information on LULC is available at the State and District level. You can use the hyperlink tool to click within the State or District (after activating the layer) and a pop-up window displays the LULC statistics for 19 classes for the previous 4 years. There is a graphical representation and a per-capita and change analysis table also for viewing. Census data of the state or district is also thrown in for good measure.

This tool really forms the main information gathering mechanism of this application. This is good solid information about the country's natural and crop resources and even if aggregated only up to the district level I imagine would be very useful for regional scale projects. I would have liked to have the same information aggregated by river basin and subbasins also. A lot of projects are done using these natural boundaries as the study area.

You can select administrative units using the query builder and use the buffer function to build a buffer of specified distance. You can collect attributes of entities falling inside the buffer, but only those entities that can be queried i.e. the admin units. The query builder does not look like a finished product. I could select only one entity at a time. The logical operators that would allow users to select conditionally failed every time I tried a selection.

Now to the dynamic spatial analysis on LULC..... Its a downer since the application doesn't really allow any interesting spatial analysis on the LULC classes.

Isn't that a strange comment to make on my part? Didn't I mention above that you can click on a State or District and get the LULC stats? Isn't that doing spatial analysis?

No... it isn't! At least not from a GIS perspective.

What a user is doing online simply amounts to an information retrieval operation using the outline of a district or a state as a guide. The LULC stats have already been generated and stored and are sent to the user on request activated by a click. The hyperlink button is really that. Its a link to data that already exists. There is no data being created and assembled on the fly through spatial analysis on the LULC classes. That's the characteristic of a dynamic GIS app. In this case NRSA has prepared the LULC information bundle on each state and district in advance. They could have just created a web page with a list of state and district names and linked each name to a LULC results page. But putting a graphic front end like the Bhoosampada map viewer and letting users click on a map makes the application look more complex than it is.

What would a dynamic spatial analysis of LULC look like?

Let's say a user builds a 50 km buffer around a town selected using the query builder and that operation also retrieves the stats of LULC classes falling inside the 50 km distance. Answers to spatial questions like this one can't be anticipated and canned and requires dynamic on the fly spatial analysis on the GIS application server and then assembling those results and sending them to the user. As it stands now such dynamic queries are restricted only to selecting administrative units or building buffers around such selected entities. Maybe there were performance or other technology issues that NRSA ran into or maybe they thought users are too stupid to think of such complex analysis.

Another area in which this application fails the user and one which is even more serious than the lack of spatial queries is in the limited data sets available for overlay. I know the focus is on LULC. But displaying this layer as an isolated dataset conveys less information about why LULC variability is the way it is.

If only geographic associations had been included!

What I mean is that a country's land cover and land use spatial patterns arise through the interplay of several natural and anthropogenic influences. Rainfall, temperature, topography, soils, geology, groundwater, river basins and roads to name some, all play a role in the distribution of natural resources and how the land is being used by humans for various purposes. Addition of these layers just for overlay and attribute information purposes if not for complex analysis would lend a larger spatial context to the LULC classes and make for a more enriching and productive user experience.

Few minor quibbles. The LULC color scheme shouted out at me. I like my GIS maps colored more earth and pastel. And some design issues. In the LULC stats table you have the option of printing but no easy option to save that information in a spreadsheet format. This is tabular info, so an option to save in excel or a database should be available. Small but important details. Finishing touches in Indian government applications are always found wanting.

And finally you can request for the actual data.

But wait... the general public can get them only as hard copies and those too at a 1: 1 million scale or a 1:250,000 scale. Only scientific users of data as recognized by the NRSA can get digital copies that can be imported into a GIS.

The legacy of India's myopic and restrictive map policy lives on. We keep waiting for the day it might change..

Bhoosampada makes it easier for users to get hold of good LULC data aggregated by state and district. The LULC map layer shows regional scale variability of natural resources and cropping patterns and the stats allow yearly comparisons in the changes to the land cover. All this is a definite plus point. But in the absence of any serious spatial query capabilities and supporting data sets for overlay it resembles more an online static LULC map atlas and data warehouse than a dynamic web GIS application.

I hope Bhuvan is different.

See also: Mapping India

Wednesday, March 25, 2009

Mapping India Using GeoCommons

Take a look at this great web mapping application. I could plot spatial data about India in a matter of minutes and make a presentable map and then share the results with like minded citizens.

FortiusOne a geographic visualization and location intelligence company has created GeoCommons - a repository for public domain data. It is a free service. You can register as a user and browse through extensive public domain datasets. This you do through a Finder module. You can then select the dataset you are interested in and either

1) download it as a Shapefile or KML (keyhole markup language) format

2) Read details of the data

3) Plot that data on a map with Maker using a background of your choice (satellite, terrain, streetview, solid). You can thematically plot your results using different attributes from the same dataset just like you can in a GIS. But this one is for free.

You can share the results of your mapping by saving them in your account and distributing the link and by downloading the results as a KML file which you can then overlay on Google Earth or Google Maps or Virtual Earth.

Here's the result of a quick experiment that I did with some India data. I picked up the CARMA (Carbon Monitoring for Action) carbon emissions from power plants dataset and made two maps in Maker. The one below shows energy generation by power plant. The size of the dots is proportional to the amount of energy generated by individual power plants. As I mentioned you can download this dataset and get you hands on data you can use and manipulate in more sophisticated spatial analysis software, but most people don't have access to this.


The distribution of mega power plants mostly follow the coal belt. You can see the largest dots are all in the central and eastern part of the country where most of India's coal deposits are situated.

The second map uses the same dataset but plots another attribute, energy intensity. This is the amount of CO2 emitted per unit of electricity generated. It is a measure of energy efficiency.


Notice that the energy intensity values in the upper range exceed average values for coal plants in the U.S, which are about 1800-2200 lbs CO2/MWh. The CARMA data I downloaded didn't categorize plants according to fuel burnt. Gas is a cleaner fuel than coal and it's a fair guess that these largest plants are coal fired. Natural gas accounts for just about 10% of power generated in India while coal accounts for about 58%. Indian coal power plants are much more inefficient at generating power than the U.S. The National Action Plan on Climate Change has an Energy Efficiency Mission, i.e. a specific directive to improve energy efficiency. It has its work cut out in the coming years.

Now hold on before you get too excited. The datasets for the U.S are vast but for India you get a very limited stock to work with. Contributions to GeoCommons is voluntary and till date I am guessing very few organizations in India using and creating public domain data know about this site. Most of the data currently available is Census data. Why such a bias? Well, this data is freely available from the Census website (site is under construction). It is stored in a non-spatial tabular format. This data has been pulled out from this site by a user and converted into a geographic format. That's easy to do with the tabular census available with the government.

That's because the data is aggregated by administrative units. If you have already have a base map with state and other administrative boundaries (which is freely available), its easy to just attach this tabular data to the geometric data using the administrative unit name as a key. This is not possible with say natural resources data where boundaries cut across administrative units. This type of data has the geometry stored along with other attributes in a special geographic format. And getting this data from the government is a lengthy process.

So how long before we start seeing more diverse datasets on India in social mapping sites like GeoCommons. That does depend upon how quickly the government implements the National Spatial Data Infrastructure, an initiative to provide easy access to public domain spatial data. Off course the availability of this data has to be coupled with government permission to upload these data onto a third party database. Right now I am not sure if having acquired government data whether you can share it using the kind of distributive model that GeoCommons uses. The rules on this are fuzzy and I really hope the NSDI will bring in some clarification of the governments stance on value addition and data sharing and see an end to the excessively restrictive and regulatory mindset that has limited the innovative use of spatial data in this country.

You don't have to wait until the NSDI takes shape to start contributing your own data to GeoCommons. If you are an organization working with spatial datasets and want to share this data, you can right now upload your data to GeoCommons. When you do so you are agreeing to its free use by others under the Creative Commons license. Anyone will be able to use this data as long as they acknowledge the data creators which is you and the data managers which is GeoCommons.

Social mapping, citizen cartography and a data sharing mechanism to initiate civic discussions on problems that have a spatial angle to them all without an expensive GIS overhead.

Try it out.

Thursday, February 5, 2009

Community Science In India Using Web Maps

After my earlier preview of Bhuvan, a Web Map service to be launched in March 09 by the Indian Space Research Organization, a reader alerted me to a web mapping portal catering to the biology community of India. The name of this service is India Biodiversity Portal and it has been built on a foundation of Google Maps imaging service.


I looked through the site to find out who built this stuff. Apparently a group of NGO's, research organizations and Universities approached the National Knowledge Commission for permission to setup this interactive portal. So, this web service can be thought of as a map based wiki where users can not only view and browse and query data but add to it as well.

Here is the Portal Charter:

It will provide a platform for aggregating and sharing data and information on biodiversity by allowing wide-spread community participation.

It will leverage the intelligence of the crowd in generating, soliciting and aggregating biodiversity information.

It will provide free and open access to biodiversity information. All contributed information will be accessible under the Creative Commons license. The license regimes under which each bit of information is shared will be clearly specified.

It will provide explicit and unambiguous attribution and credit the source of the information.

It will facilitate social networking and build an open community of amateurs, naturalists, professionals, scientists, and others who are interested in the biodiversity of India.

We will build mechanisms for aggregating and validating information by the community, inspired by the large scale success of the wiki.

We believe in building a positive, respectful and trustful participatory environment that benefits science and society, and contributes to a sustainable future.

The language is frankly shocking, even seditious. Open and free access.... sharing data and information...... social networking and open community....... trustful participatory environment. I am not used to hearing this!

A few years ago all these terms were an oxymoron as far as spatial data was concerned. I mean how dare you share data and maps with someone else without the government's permission?!

My experience has been more like....no you cannot have that data....... security concerns..........access delayed....Ministry of Defence clearance required........

.....but I just want to map the distribution of amphibians along riverine habitats.....what?.... no I don't think that poses a threat to national security.

.......project cancelled.

Jokes apart this portal shows that scientists and other users of spatial data in India desperately want an open and transparent environment that enables them to quickly acquire, value add, share data and set up collaborative projects that engage as wide a user base as possible. This portal is a reflection of a new mind set which has been missing for so long in this country.

There are collateral benefits of projects such at this one. You often wonder, ..how do you get the public at large interested in science? How do you get people who are not involved in science professionally to inculcate the scientific outlook? Applications like this map wiki is an example of how it can be done. Anyone can come here, browse through biology and environment data layers, get curious about the world around them, ask critical questions about the state of the environment in the location they live, start a project and contribute to building a database (you have to be a registered user) and start feeling more connected with science and the scientific way of thinking. A virtual meeting place that allows citizens ranging from professional users of spatial data to high school students to initiate a much needed and long overdue conversation with the Indian scientific community. I feel one of the most effective ways to raise public awareness and support for science is through interactive projects like this one.

The makers of Bhuvan would do well to take a long look at such emerging applications. I want to stress again that it will not be the quality of images or the technology itself that will decide whether Bhuvan will succeed in grabbing a significant share of users away from Google Maps, but whether users will be able to access the Bhuvan API and customize Bhuvan to their needs and build innovative location data based applications on top of ISRO's images.

It is the openness and participatory nature of applications like this Biodiversity portal that Bhuvan will be competing against.

More power to them.