My
post series on GIS web mapping applications for users to view, browse and query Indian spatial datasets continues. This post is on an application that allows users to view and get information about the land use and land cover of India.
Bhoosampada is the name of the application (it means earth's bounty, a reference to natural resources of India) developed under the aegis of the
National Remote Sensing Centre, Hyderabad, India. Other Indian space organizations based in Dehradun, Jaipur and Bangalore have contributed to this project. It promises the user a rapid assessment of national level land use and land cover.
Right on! Entry to the application was surprisingly quick. I had to register, but the response was automated and I got my user name and password validated in a jiffy. I had given my India address. I would love to see someone from outside India try to register as a check on whether that causes the "security issues" mandarins any heartaches. If anyone has tried it do let me know.
Anyways below is the application interface.
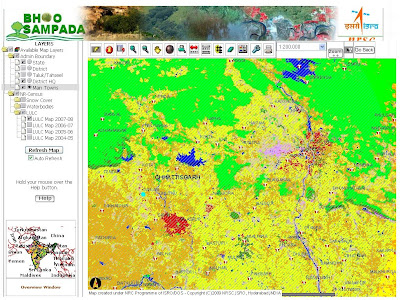
It's a standard web mapping interface. The default view is an outline of India with the land use and land cover (LULC) overlaid. You can zoom and pan using the tools or zoom to a predetermined scale using the scale tool. The choice is from 1:1 million to 1: 200,000. Not that great I know! But apparently this is a National level LULC mapping effort that will be done on a yearly basis on a 1:250,000 scale. So for the time being users have to deal with a somewhat coarse dataset.
The LULC classes have been derived using a classification scheme on imagery from the IRS-P6 or Resourcesat-I satellite's Advanced Wide Field Sensor (AWiFS) with additional imagery input from earlier IRS series sensors. The pixel resolution is 56 m. The
NRSA project manual describes in detail all the satellite image processing and classification methodology along with metadata standards.
In the layer list there are two types of layers. Those that can be queried and those that are only for display. Layers only for display are the LULC classes, water bodies and snow cover. Layers that can be queried are administrative boundaries- State, District, Taluka, District Headquarters and Major Towns.
Information on LULC is available at the State and District level. You can use the hyperlink tool to click within the State or District (after activating the layer) and a pop-up window displays the LULC statistics for 19 classes for the previous 4 years. There is a graphical representation and a per-capita and change analysis table also for viewing. Census data of the state or district is also thrown in for good measure.
This tool really forms the main information gathering mechanism of this application. This is good solid information about the country's natural and crop resources and even if aggregated only up to the district level I imagine would be very useful for regional scale projects. I would have liked to have the same information aggregated by river basin and subbasins also. A lot of projects are done using these natural boundaries as the study area.
You can select administrative units using the query builder and use the buffer function to build a buffer of specified distance. You can collect attributes of entities falling inside the buffer, but only those entities that can be queried i.e. the admin units. The query builder does not look like a finished product. I could select only one entity at a time. The logical operators that would allow users to select conditionally failed every time I tried a selection.
Now to the dynamic spatial analysis on LULC.....
Its a downer since the application doesn't really allow any interesting spatial analysis on the LULC classes.Isn't that a strange comment to make on my part? Didn't I mention above that you can click on a State or District and get the LULC stats? Isn't that doing spatial analysis?
No... it isn't! At least not from a GIS perspective.
What a user is doing online simply amounts to an information retrieval operation using the outline of a district or a state as a guide. The LULC stats have already been generated and stored and are sent to the user on request activated by a click. The hyperlink button is really that.
Its a link to data that already exists. There is no data being created and assembled on the fly through spatial analysis on the LULC classes. That's the characteristic of a dynamic GIS app. In this case NRSA has prepared the LULC information bundle on each state and district in advance. They could have just created a web page with a list of state and district names and linked each name to a LULC results page. But putting a graphic front end like the Bhoosampada map viewer and letting users click on a map makes the application look more complex than it is.
What would a dynamic spatial analysis of LULC look like?
Let's say a user builds a 50 km buffer around a town selected using the query builder and that operation also retrieves the stats of LULC classes falling inside the 50 km distance. Answers to spatial questions like this one can't be anticipated and canned and requires dynamic on the fly spatial analysis on the GIS application server and then assembling those results and sending them to the user. As it stands now such dynamic queries are restricted only to selecting administrative units or building buffers around such selected entities. Maybe there were performance or other technology issues that NRSA ran into or maybe they thought users are too stupid to think of such complex analysis.
Another area in which this application fails the user and one which is even more serious than the lack of spatial queries is in the limited data sets available for overlay. I know the focus is on LULC. But displaying this layer as an isolated dataset conveys less information about why LULC variability is the way it is.
If only geographic associations had been included!
What I mean is that a country's land cover and land use spatial patterns arise through the interplay of several natural and anthropogenic influences. Rainfall, temperature, topography, soils, geology, groundwater, river basins and roads to name some, all play a role in the distribution of natural resources and how the land is being used by humans for various purposes. Addition of these layers just for overlay and attribute information purposes if not for complex analysis would lend a larger spatial context to the LULC classes and make for a more enriching and productive user experience.
Few minor quibbles. The LULC color scheme shouted out at me. I like my GIS maps colored more earth and pastel. And some design issues. In the LULC stats table you have the option of printing but no easy option to save that information in a spreadsheet format. This is tabular info, so an option to save in excel or a database should be available. Small but important details. Finishing touches in Indian government applications are always found wanting.
And finally you can request for the actual data.
But wait... the general public can get them only as hard copies and those too at a 1: 1 million scale or a 1:250,000 scale. Only scientific users of data as recognized by the NRSA can get digital copies that can be imported into a GIS.
The legacy of India's myopic and restrictive map policy lives on. We keep waiting for the day it might change..
Bhoosampada makes it easier for users to get hold of good LULC data aggregated by state and district. The LULC map layer shows regional scale variability of natural resources and cropping patterns and the stats allow yearly comparisons in the changes to the land cover. All this is a definite plus point. But in the absence of any serious spatial query capabilities and supporting data sets for overlay it resembles more an online static LULC map atlas and data warehouse than a dynamic web GIS application.
I hope
Bhuvan is different.See also:
Mapping India


