Thursday, May 28, 2009

Online Books On Carbonate Geology

Wiley Interscience maintains quite an extensive archive of online geology books. I've bookmarked a couple of their journals and usually go over to browse through the latest issue of Basin Research and decided to explore the site further. 
There's lots to catch the attention of sedimentary geologists.  Here is a list of online books available on carbonates:
There is plenty for clastic sedimentary geologists too and other books on related topics of sedimentation and tectonics. 
This one caught my eye: PreCambrian Sedimentary Environments
I first developed an interest in carbonate sedimentology during a graduate mapping project in the Proterozoic Cuddapah basin of south India.  It was a sequence of stromatolite dolostones, limestones and quartz arenites exposed mostly along the south dipping limbs of an anticline. 
You can see the dip slopes in the image below.
The hard part of working on Proterozoic carbonates was that most books and atlases on sedimentary lab training use fossiliferous Phanerozoic carbonates as examples for descriptions of carbonate textures and grains and fabrics. And the Proterozoic textures I was looking at were to me at first ...as clear as mud.
I mean that literally. All I saw in those rocks was carbonate mud.
What strikes you about Proterozoic carbonates when you have looked at a lot of them is the overall rarity of sand facies. That's due to the absence of metazoans which started contributing skeletal particles and fecal pellets begining Phanerozoic times. Ooids and intraclasts do occur but they are spatially restricted. But there are lots of weird and wonderful fabrics and cements in these rocks. PreCambrian carbonate platforms were dominated by microbial communities and chemical precipitates and these do form environment diagnostic associations,  just like Phanerozoic facies.
It took getting used to but I was hooked. I do wish though that someone would create a lab handbook which documents Proterozoic carbonate microfabrics and microfacies (would be a great post series too). That would make a most helpful reference manual for carbonate sedimentologists.
Oh.. all these books are pay access...but it really is a bonanza if you have a subscription through your University or otherwise.

Wednesday, May 27, 2009

Epistemology Of Speciation

I am always on the lookout for better ways to express the evidence for evolution.  One common doubt is that we have never actually  observed one species giving rise to a new species, so how do we know that speciation occurs in nature? 

I liked this view by Steve Mirsky from his recent article in Scientific American on Are Dog Breeds Actually Different Species?
The claim makes me think of the trial where a man was charged with biting off another man’s ear in a bar fight. (Incredibly, Mike Tyson was not involved.) An eyewitness to the fracas took the stand. The defense attorney asked, “Did you actually see with your own eyes my client bite off the ear in question?” The witness said, “No.” The attorney pounced: “So how can you be so sure that the defendant actually bit off the ear?” To which the witness replied, “I saw him spit it out.” We have the fossils, the intermediate forms, the comparative anatomy, the genomic homologies—we’ve seen what evolution spits out.
Funny and definately quotable. 
Tip: WEIT

Monday, May 25, 2009

Sandman Michael Welland On Radio

Michael Welland who writes the fascinating blog Through The Sandglass was on New England Public Radio Station WICN for an interview: Inquiry with Mark Lynch. 
Philosopy, engineering, quicksand and beaches made up of parrotfish poo! All packed in an entertaining 28 minutes.
Great talk Michael!

Thursday, May 21, 2009

Geology Search Using Wolfram Alpha

The much hyped engine is here.

Is Wolfram Alpha a search engine?

No. It's a computational knowledge engine: it generates output by doing computations from its own internal knowledge base, instead of searching the web and returning links.

Input: Calcite Aragonite Dolomite

Results: Wolfram Alpha

You can compare any mineral this way and get a table of properties. A similar search using rock names for example basalt granite gabbro brings up a table with the thermal and mechanical properties. Not all rock types yield a satisfactory answer. I tried to compare sandstone and limestone and there was partial data only for chalk. Queries like olivine solidus or melting temperature granite got no results.

You can do computation with the quantitative attributes.

tensile strength basalt / granite

density coesite /quartz


That is the aim of Wolfram Alpha- to make it possible to compute anything that is computable.

Queries like earthquakes yields a lot of info. You can get a translation of the Richter scale in energy equivalents and earthquake information for any country like the one I tried for India below.


Results: Wolfram Alpha

There were some surprises. I queried dinosaurs and apparently their database has enough information to compare weights of different dinosaur species. Want to know whether Brontosaurus or T. Rex was heavier. Just provide the species name!

Don't try to use this as a geology term dictionary. You will come up empty for most types of inputs. It's not meant to be that kind of reference.

There were humorous moments:


Results: Wolfram Alpha

No geological time information? There is but you have to put in a numerical input:


Results: Wolfram Alpha

It works best with pieces of information that have quantitative attributes to it. For more general knowledge and descriptive queries you will have to stick to Google or whichever other web source you prefer.

W Alpha is still in Beta according to the makers and always will be.

It was fun. Try it out. I don't anticipate using it a whole lot, at least not as much as a regular search engine.

Economist has a article on it and CNET has a bunch of reviews.

Wednesday, May 20, 2009

Specially For Dog Lovers

Just a quick pointer to a really interesting talk on the modern dog and recent work on the genetics, dog diseases and evolution of man's best friend.

Go to NPR Science Friday to listen or download the podcast.

There is a link to an earlier talk on evolution of dogs which is also worth listening to. Genetic and fossil data suggest domestication of dogs began as early as 15,000 to 20,000 years ago.

Here's an intriguing question. Humans have controlled the evolution of dogs, but did the inclusion of dogs in the Pleistocene human social milieu influence human evolution? Nicholas Wade in his book Before the Dawn has suggested that dogs may have helped humans make the transition from foraging to settled societies. People who settle down in one place risk being attacked and dogs who attach themselves to a owner would have been sentries keeping guard.

Did that also reduce violence in general, make us less aggressive? Human skeletal morphology has changed a bit in the last 20,000 years or so. We have more gracile features - smaller and thinner skulls, smaller teeth than earlier humans. Some experts like primatologist Richard Wrangham believes that this gracilization could have occurred if aggression was less beneficial and evolution favored pedomorphic changes i.e. retention of juvenile features in adulthood. Adult aggressive traits would have then diminished over time.

Maybe dogs had something to do with this? If we outsourced violence or prevented it because of their presence.

Thursday, May 14, 2009

Maldives Reef Sea Level Curves: What About Palk Strait....And Ram Sethu?

A paper in the May issue of Geology by P.S. Kench, S.G. Smithers, R.F. McLean, and S.L. Nichol works out the Holocene sea level history of the Maldives:

Holocene reef growth in the Maldives: Evidence of a mid-Holocene sea-level highstand in the central Indian Ocean

Radiometrically calibrated ages from three reef cores are used to develop a Holocene reef growth chronostratigraphy and sea-level history in the Maldives, central Indian Ocean. Last interglacial reef (U-series age 122 ± 7 ka) was encountered at 14.1 m below mean sea level. An age of ca. 8100 calibrated (cal) yr B.P. immediately overlying this Pleistocene surface records the initiation of Holocene reef growth. Massive in situ corals occur throughout the cores and the consistency of the three age-depth plots indicate that the reef grew steadily between 8100 and 6500 cal yr B.P., and at a decreasing rate for the next 2 k.y. The position of modern sea level was first achieved ca. 4500 cal yr B.P. and sea level reached at least 0.50 ± 1 m higher from 4000 to 2100 cal yr B.P. before falling to present level. Emergent fossil microatolls provide evidence of this higher sea level.

Results are significant to two long-standing issues relating to Maldivian sea level history. First, the ambiguity of a late Holocene highstand has been resolved with clear evidence of its existence reported here. Second, the uncertainty of the regional pattern of sea-level change in the central Indian Ocean has been clarified, the Maldivian results broadly agreeing with island records in the eastern, rather than western Indian Ocean. Our results provide the first field evidence confirming geophysical model projections of a highstand 4–2 k.y. ago in the central Indian Ocean, though the observed level (+0.50 ± 0.1 m) is lower than that projected
.

As sea level rises coral reefs grow upwards. They thus track the rising sea level. Using the relationship between depth at which corals of a particular age are found the researchers calculated that following the end of the last glaciation, sea level rose uninterrupted at a faster rate between 8100-6500 years ago and then at a slower rate between 6000-2000 years ago. There has been a minor drop of around 0.5 metres since. This drop is indicted by emergent coral atolls i.e corals which are now exposed above sea level and are dead. That would mean that in the past sea level was higher.

How can one be sure that sea-level rose continuously? Could it have been interrupted by a sea-level drop? The Holocene corals don't show any evidence of any significant sea-level drop. Discoloration and recrystallization - signs of meteoric diagenesis- are absent and the mineralogy of the corals is 95%-99% aragonite, which again indicates no contact with fresh water. Aragonite is stable in sea-water but will alter to calcite during fresh water incursions.

So this use of coral reef growth as a proxy for sea level change is a common technique in constructing local sea level curves. How local are these curves? It would be hard to extrapolate the Maldives curve as a general statement on the Indian ocean since the Maldives are a relatively isolated island chain. Fortunately we have more data. The paper refers to previous work done in the eastern Indian ocean at Cocos island and on the western Indian ocean sites of Reunion and Mauritius. The eastern sites are in agreement with the Maldives sea-level curves while in the western sites evidence of the late Holocene highstand and later drop in the form of emergent atolls and reefs is not present. But for most of the Holocene they concur with the Maldives.

Look at the figure below for geographic orientation.


This Holocene sea-level curve is beginning to look like it applies to a wide regional extent of the central and northern Indian ocean.

As my post title indicates what does this say about the Palk straits, which is a narrow body of water separating the coasts of south India and Sri Lanka. Well, as it happens the Holocene sea-level history of the straits is of huge interest not just to geologists but to ...say... about 900 million plus Hindus.

The Indian epic Ramayan tells the story of king Ram who crossed the Palk Straits with his army to rescue his wife Sita held prisoner by emperor Ravana of Lanka. Legend has it that the sea-level was low and had exposed most of the Palk strait sea bed. Ram's army build a causeway (Ram Sethu) over the remaining stretches of water and walked across into Sri Lanka (why didn't they take a boat?....beats me!). Supporters say they can see the causeway from satellite images and there is physical evidence too. I have dispelled the many myths regarding this bridge in this post and here.

The Ramayan like many other Indian epics like the Mahabharata existed and was passed down generations as an oral narrative recording Indian society beginning maybe as early as 1000 B.C. (3000 B.P.) until it was compiled as a written document sometime early A.D. So the epic contains early enough memories for us to speculate whether the legend of a low sea-level could have a physical basis and whether a late Holocene sea -level drop could have exposed the Palk strait sea bed.

The central / north Indian ocean sea level curve (Maldives, Cocos, Reunion) says no sea level drop of a few meters in the late Holocene or for that matter the entire Holocene. But basins like the Palk strait which are attached to large continents may not have the same sea-level history as recorded on isolated islands. Tectonic uplift or subsidence and patterns of sedimentation, especially influx of large amounts of clastic sediment from the continental mainland may result in a local sea -level history different from surrounding regions.

Has that happened in the Palk strait? Unfortunately the kind of detailed studies that this paper represents using corals have not been done. Overall the Holocene history looks similar to the Maldives. As the last glaciation ended an exposed Pliocene-Pleistocene surface was flooded by rising sea-levels beginning early Holocene (8000-9000 B.P.) Coral growth was initiated and continues until present day. Like the Maldives there are emergent coral atolls and coral-sand islands (Rameshwaram). The younger exposed corals are dated to around 2600 B.P. which speak to a late Holocene highstand and then a slight drop in sea-level of about one meter or so.

There are geologists and geo-archaeologists who won't agree with this at all. They will bring up the same objections I outlined above regarding the reliability of extrapolating of sea-level curves. I have spoken to some of them and they insist and there are "findings" that show that Holocene sea-level rise and coral growth in the Palk Strait was interrupted by a sea-level drop of several meters sometime several thousand years ago and that would have exposed most of the sea-bed between India and Sri Lanka. I hope they publish these findings and make their data available for others to review.

Fundamentalists engage in a most literal interpretation of scripture. But amongst the many fantasies, exaggerations and story telling there may also be a record of some real event. A late Holocene sea-level drop in the Palk strait is not out of the question, despite what the Maldives sea-level curve is telling us. This is a small basin adjoining a large continent and it may have a peculiar history of its own.

I would love to see this north Indian ocean Holocene puzzle solved.

Wednesday, May 13, 2009

Best U.S. Earth Sciences Graduate Programs

US News and World Report has published their list of the best Earth Sciences Graduate Programs.

Top Earth Sciences Programs

California Institute of Technology - 1
Massachusetts Institute of Technology - 2
Stanford University - 2
University of California, Berkeley - 4
Columbia University - 5
University of Michigan - Ann Arbor - 5
Pennsylvania State University- University Park - 7

See expanded list...

List of Specialities...

Geochemistry
Geology
Geophysics and Seismology
Paleontology

University of Chicago tops the Paleontology program. My Ph.D. adviser was a Chicago graduate and I kept hearing from him how great the palaeontologist faculty was.

I guess it was all true! But really John Sepkoski Jr. , Leigh Van Valen, David Jablonski... they are all legends in their field.

On a related education note, Money Magazine (via Joe Meert at Scienceantiscience blog) has a good article on the rising cost of public university education, the reasons and what parents and students can do to meet these costs.

They end with a good piece of advice:

The personal return on education certainly is large. Harvard economists Claudia Goldin and Lawrence Katz calculate that college grads earn 60% more than those who stop at high school...

Patrick Callan of Education Policy Centre concurs- The real difference in America is not between people who go to Florida and those who go to Central Florida..It's between those who go to college and finish and those who don't.

Finish your degree!

Tip: Nanopolitan

Monday, May 11, 2009

A One Billion Dollar Geological Map Of The Arctic

That's what it has cost approximately for Canada, Russia, the United States, Denmark, Norway, Finland and Sweden to collaborate and share data and produce a geological map of the circum- polar arctic region. I imported a MrSid digital version of the map in my Manifold GIS. I downloaded the digital version from the Natural Resources Canada digital data download site. There are JPEG 2000 and Acrobat versions of the image also available.


More details from Spatial Sustain:

A collaborative geological map of Arctic geology across circumpolar countries was completed in November 2008 as part of the International Polar Year. The 1:5,000,000 scale bedrock geology map and related digital data sets relate to the objectives of the Commission for the Geological Map of the World.

The project objectives were to compile details to produce a hardcopy map of the circumpolar Arctic, while also synthesizing data to form a spatial database. The archive will provide the means to create additional digital products. This effort serves as a model for subsurface spatial data collection for other parts of the globe....


Its not just the arctic sea bed that is of interest to countries. See also this article by the Economist on sea-bed mineral riches and the economic and technological hurdles faced by countries trying to exploit these resources. India for example has been wanting to exploit manganese nodules from the Arabian deep sea for decades. There has not been any successful commercial exploitation yet but that might change in the future.

Countries have a sovereign right to exploit the sea bed up to 200 miles from their coasts. The 1982 UN Convention on the Law of the Sea allows countries to extend their claim if they can show that their continental shelves extend beyond this range. For countries who ratified this convention before May 13 1999, the deadline to submit these claims is May 13 2009. There is a lot of real estate at stake here. Around 15 million sq km of it. Canada is seeking 1.7m sq km but get this ... eight Pacific island nations including Fiji are claiming 1.5 m sq km! With hundreds of islands they have a lot of coastline that can in principle be extended. I am not familiar with the geology of the Pacific islands but Fiji does claim that there is oil and gas to be exploited from carbonate reefal traps of Cenozoic age.

India has a couple more days to submit its claim. No new yet about that... but Pakistan already has. Of particular importance is the deep water Indus river fan and deltaic system. That is likely to have significant hydrocarbon potential.

Friday, May 8, 2009

Hobbits Are In The News Again

Those enigmatic bones from the island of Flores interpreted to be the remains of a 3 feet tall hominid known as Homo floresiensis are making waves again. This tiny hominid lived as recently as 17,000 years ago. Bones are associated with stone tools, an indication that this creature had some smarts.

There are three main hypothesis as to where to place this creature within the hominid family tree.

1) Ancestor Homo erectus migrated to Flores island maybe more than a million years ago and then that population shrank in stature, a process known as insular dwarfing. Also some reversal in traits occurred, a hypothesis required to explain the primitive (ancestral state) nature of wrists and feet.

2) Descended from an ancestor even older than Homo erectus ...maybe Homo habilus..? and then underwent dwarfism on Flores island. Could explain the puzzling primitive traits (wrists and feet) in the descendant hobbits and the small brain size. One problem with this hypothesis is that no other fossil hominids earlier than Homo erectus are known outside Africa ...so far.

3) Bones belong to diseased modern humans. No special evolutionary scenario required.

There's been lots of reading about some of the latest findings on Hobbits. I found this review on the Origins blog most well written and information. NY Times also has a couple of good articles here and here.

One thing that has struck me about this debate is how integral the field of developmental biology is becoming in fashioning evolutionary hypothesis not just to explain trends in size and shape and novel features but to ascertain ancestry and evolutionary relationships.

And bridging these two fields in this case is not molecular genetics, embryos and Hox genes ..... but bones.

Wednesday, May 6, 2009

Florida State Geosciences In An Existential Quandary

Geology and livelihoods - 5

I've been having an email to and fro with my Ph.D adviser. There is bad news coming out of Florida State Univ, Geology department. The extreme scenario is that the department may be dissolved. There is a chance that budget cuts may be that bad. Faculty has proposed a workaround that may save the program or at least some part of it and that would be by merging with Oceanography. The joint undergraduate degree will go by the name "Environmental Science" and would have less stringent requirements of math and physics.

Such an interdisciplinary degree course might mean a number of core geology courses might not be taught at all. I just wonder if crystallography, mineral optics, advanced igneous / metamorphic will get axed ... along with a few faculty! Apparently geoscience enrollment at Florida State has been in the decline for the last decade or so and the University going through a list of departments targeted geology .. and presumably oceanography.

I don't have news on what the syllabus of this new proposed course would be like. Florida State offered quite a well rounded geology undergraduate degree with a really good summer field camp in New Mexico for majors. By the name of it - Environmental Science- it looks like the orientation will be more towards applied courses... you know getting graduates trained for the modern marketplace. Maybe courses will be tailored to address problems close to home. Those would be coastal processes, surface and groundwater hydrology, soil sciences..?

All this doesn't really go too well with less math and physics. Students with a math background would have an advantage in the the modern marketplace whether they come out with a geology degree or an environmental science one. But the department and the University is in survival mode right now and getting more students enrolled is the priority even if that means lowering the standard of a science degree. I can't help thinking whether in a weird way this new arrangement might help at least some students think about the graduate geoscience stream. I've run into students taking their first undergraduate geology course, liking it, but then balking at the prospect of graduating in geology because of the calculus requirement. So they stop taking geology courses after that. Maybe this way with no math requirement a lot more students might complete an environmental sciences undergraduate degree and then decide that they like the subject enough to get over their fear of math which would be part of the graduate degree requirement.

That's just me trying to put a positive spin on a damp situation. I hope some survival strategy works and faculty don't lose their jobs ... chances are that some might. And right now I'm just upset that come fall my old department will be living only in my memory.

See: Geology and livelihoods

Tuesday, May 5, 2009

Bill Maher Speaks On Swine Flu

Funny video!

It really cracks me up on how much ridicule fundamentalists and creationists invite.

Take a look


Will creationists now just pray that the flu goes away or secretly hope that researchers using evolutionary reasoning find out a way to stop this virus?

Tip: WEIT

Friday, May 1, 2009

Land Use Web Maps Through Bhoosampada; I Hope Bhuvan Is Not Like This

My post series on GIS web mapping applications for users to view, browse and query Indian spatial datasets continues. This post is on an application that allows users to view and get information about the land use and land cover of India.

Bhoosampada is the name of the application (it means earth's bounty, a reference to natural resources of India) developed under the aegis of the National Remote Sensing Centre, Hyderabad, India. Other Indian space organizations based in Dehradun, Jaipur and Bangalore have contributed to this project. It promises the user a rapid assessment of national level land use and land cover.

Right on! Entry to the application was surprisingly quick. I had to register, but the response was automated and I got my user name and password validated in a jiffy. I had given my India address. I would love to see someone from outside India try to register as a check on whether that causes the "security issues" mandarins any heartaches. If anyone has tried it do let me know.

Anyways below is the application interface.


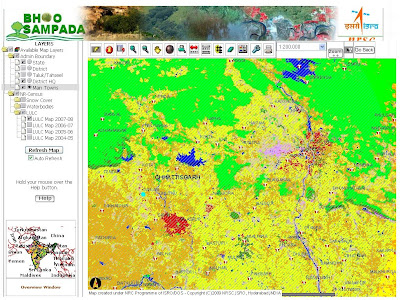
It's a standard web mapping interface. The default view is an outline of India with the land use and land cover (LULC) overlaid. You can zoom and pan using the tools or zoom to a predetermined scale using the scale tool. The choice is from 1:1 million to 1: 200,000. Not that great I know! But apparently this is a National level LULC mapping effort that will be done on a yearly basis on a 1:250,000 scale. So for the time being users have to deal with a somewhat coarse dataset.

The LULC classes have been derived using a classification scheme on imagery from the IRS-P6 or Resourcesat-I satellite's Advanced Wide Field Sensor (AWiFS) with additional imagery input from earlier IRS series sensors. The pixel resolution is 56 m. The NRSA project manual describes in detail all the satellite image processing and classification methodology along with metadata standards.

In the layer list there are two types of layers. Those that can be queried and those that are only for display. Layers only for display are the LULC classes, water bodies and snow cover. Layers that can be queried are administrative boundaries- State, District, Taluka, District Headquarters and Major Towns.

Information on LULC is available at the State and District level. You can use the hyperlink tool to click within the State or District (after activating the layer) and a pop-up window displays the LULC statistics for 19 classes for the previous 4 years. There is a graphical representation and a per-capita and change analysis table also for viewing. Census data of the state or district is also thrown in for good measure.

This tool really forms the main information gathering mechanism of this application. This is good solid information about the country's natural and crop resources and even if aggregated only up to the district level I imagine would be very useful for regional scale projects. I would have liked to have the same information aggregated by river basin and subbasins also. A lot of projects are done using these natural boundaries as the study area.

You can select administrative units using the query builder and use the buffer function to build a buffer of specified distance. You can collect attributes of entities falling inside the buffer, but only those entities that can be queried i.e. the admin units. The query builder does not look like a finished product. I could select only one entity at a time. The logical operators that would allow users to select conditionally failed every time I tried a selection.

Now to the dynamic spatial analysis on LULC..... Its a downer since the application doesn't really allow any interesting spatial analysis on the LULC classes.

Isn't that a strange comment to make on my part? Didn't I mention above that you can click on a State or District and get the LULC stats? Isn't that doing spatial analysis?

No... it isn't! At least not from a GIS perspective.

What a user is doing online simply amounts to an information retrieval operation using the outline of a district or a state as a guide. The LULC stats have already been generated and stored and are sent to the user on request activated by a click. The hyperlink button is really that. Its a link to data that already exists. There is no data being created and assembled on the fly through spatial analysis on the LULC classes. That's the characteristic of a dynamic GIS app. In this case NRSA has prepared the LULC information bundle on each state and district in advance. They could have just created a web page with a list of state and district names and linked each name to a LULC results page. But putting a graphic front end like the Bhoosampada map viewer and letting users click on a map makes the application look more complex than it is.

What would a dynamic spatial analysis of LULC look like?

Let's say a user builds a 50 km buffer around a town selected using the query builder and that operation also retrieves the stats of LULC classes falling inside the 50 km distance. Answers to spatial questions like this one can't be anticipated and canned and requires dynamic on the fly spatial analysis on the GIS application server and then assembling those results and sending them to the user. As it stands now such dynamic queries are restricted only to selecting administrative units or building buffers around such selected entities. Maybe there were performance or other technology issues that NRSA ran into or maybe they thought users are too stupid to think of such complex analysis.

Another area in which this application fails the user and one which is even more serious than the lack of spatial queries is in the limited data sets available for overlay. I know the focus is on LULC. But displaying this layer as an isolated dataset conveys less information about why LULC variability is the way it is.

If only geographic associations had been included!

What I mean is that a country's land cover and land use spatial patterns arise through the interplay of several natural and anthropogenic influences. Rainfall, temperature, topography, soils, geology, groundwater, river basins and roads to name some, all play a role in the distribution of natural resources and how the land is being used by humans for various purposes. Addition of these layers just for overlay and attribute information purposes if not for complex analysis would lend a larger spatial context to the LULC classes and make for a more enriching and productive user experience.

Few minor quibbles. The LULC color scheme shouted out at me. I like my GIS maps colored more earth and pastel. And some design issues. In the LULC stats table you have the option of printing but no easy option to save that information in a spreadsheet format. This is tabular info, so an option to save in excel or a database should be available. Small but important details. Finishing touches in Indian government applications are always found wanting.

And finally you can request for the actual data.

But wait... the general public can get them only as hard copies and those too at a 1: 1 million scale or a 1:250,000 scale. Only scientific users of data as recognized by the NRSA can get digital copies that can be imported into a GIS.

The legacy of India's myopic and restrictive map policy lives on. We keep waiting for the day it might change..

Bhoosampada makes it easier for users to get hold of good LULC data aggregated by state and district. The LULC map layer shows regional scale variability of natural resources and cropping patterns and the stats allow yearly comparisons in the changes to the land cover. All this is a definite plus point. But in the absence of any serious spatial query capabilities and supporting data sets for overlay it resembles more an online static LULC map atlas and data warehouse than a dynamic web GIS application.

I hope Bhuvan is different.

See also: Mapping India