Monday, May 31, 2010

The Life History Of One Uranium Nuclei

One final nugget from E = mc2

Uranium235 is a nuclei which can undergo spontaneous fission. Radioactivity is a stochastic process and it is not possible to predict exactly when any one particular nuclei will decay. However "mean lifetime" (T) or "decay constant" (reciprocal of mean lifetime) is a measure of the longevity of a nuclei and is proportional to the half life of the isotope; t1/2 = Tln2. U235 has a half life (t1/2) of about 700 million years. That means that any one U235 nuclei may remain stable without decaying for hundreds of millions to few billion years....unless it is made to decay by inducing fission...

...which is what happened to a few U235 nuclei when the bomb hatches of the Enola Gay opened and Little Boy began hurtling towards Hiroshima:

The uranium atoms mined on Earth were each over 4.5 billion years old. Only a very powerful force , before the Earth was formed had been able to squeeze their electrically crackling protons together. Once that uranium had been formed, the strong nuclear force had acted, gluelike, to hold these protons in place over all that long span; while the Earth cooled, and continents formed; as America separated from Europe, and the North Atlantic Ocean slowly filled; as volcanic bursts widened on the other side of the globe, forming what would become Japan. A single extra neutron unbalanced that stability now...

... the density of uranium was enough that a chain reaction started, and soon there weren't just two speeding fragments of uranium nuclei, there were four, then eight, then sixteen, and so on. Mass was "disappearing" within the atoms, and coming out as the energy of speeding nuclei fragments. E = mc2 was now under way.

1900 feet over Hiroshima, a few billion years of stable existence for those U235 nuclei ended. Nature hangs by a precarious balance...

Saturday, May 29, 2010

Preparing For The Next Big Oil Spill

David Brooks writes a perceptive column in NY Times in which he argues that preparation for the next big disaster has to include not just better technical and mechanical processes but improvements in understanding human psychology which is not very good at complicated risk assessment:

So it seems important, in the months ahead, to not only focus on mechanical ways to make drilling safer, but also more broadly on helping people deal with potentially catastrophic complexity. There must be ways to improve the choice architecture — to help people guard against risk creep, false security, groupthink, the good-news bias and all the rest. 

This isn’t just about oil. It’s a challenge for people living in an imponderably complex technical society.

He quotes Malcolm Gladwell a lot.... synthesizer of stories on how seemingly disparate small events can link up and cascade into a really big event.

Wednesday, May 26, 2010

Computers And Sexism In 1920's Harvard

When astronomy student Cecilia Payne arrived at Harvard in 1923:

...She also got a glimpse of what was going on in the back rooms of the Observatory. In 1923, the word computer did not mean an electrical machine. It meant people whose sole job was to compute. At Harvard, it was applied to ranks of slump-shouldered spinsters in those back rooms. A few of them had once had first-rate scientific talent ("I've always wanted to learn the calculus," one said, "but [the director] did not wish it"), yet that was usually long since crushed out of them, as they were kept busy measuring star locations, or cataloging volumes of previous results. If they got married they could get fired; if they complained of their low salaries, they would get fired as well.

...A few of the Harvard "computers" in several decades of bent-back work, succeeded in measuring over 100,000 spectral lines. But what it meant, or how it fitted in with the latest developments in physics, was almost always not for them to understand.

Cecilia Payne though went on to discover that the Sun was largely composed of hydrogen. At that time the understanding was that the Sun is composed mostly of iron and Payne's discovery was dismissed.  The eminent astronomers of that time discredited her and forced her to admit in her thesis:

"The enormous abundance [of hydrogen]...is almost certainly not real".

All this after Cecilia Payne had run away from Britain to escape the stifling discrimination against women pursuing science careers there.

...again from E=mc2.

Tuesday, May 25, 2010

A Quiet Beginning To A Giant Explosion

I am reading E = mc2 A Biography of the World's Most Famous Equation by David Bodanis.

Here is a passage about the pivotal moment in 1938 in Sweden when Lise Meitner and her nephew Robert Frisch worked out how much energy is released by the fission of one uranium nucleus:

...Fortunately [ my aunt] remembered how to compute the masses of nuclei.... and in that way she worked out that the two nuclei formed by the division of a uranium nucleus would be lighter than the original uranium nucleus, by about one-fifth the mass of a proton. Now whenever mass disappears, energy is created, according to Einstein's formula E = mc2  ....

..They had crossed a river on their walk out from Kungalv and it was frozen. The village was too far away to hear any market noises. Meitner did the calculation. Frisch remembers later: " One-fifth of a proton mass was just equivalent  to 200 MeV. So here was the source of that energy; it all fitted!"

The atom was open. Everyone has been wrong before. The way in wasn't by blasting harder and harder fragments at it. One women and her nephew, quiet in the midday snow, had now seen that.

The equation is always linked to Einstein and his work... but this book explores the role of physicists and chemists going back to Lavoisier, Faraday and Maxwell among others whose work on mass and energy built the foundation Einstein stood on and a later cast of characters who worked out the broader implications of the equation.

The added attraction is a suspenseful commando raid that destroyed Germany's heavy water supply essential to its growing nuclear program.

..Terrific stuff..

Wednesday, May 19, 2010

Accretionary Wedge: Geo-Images ..Calcite Cements

Entry for the Accretionary Wedge carnival hosted by Chris and Anne at Highly Allochthonous.

When I viewed these crystals under a microscope for the first time... I felt more relief than elation. I finally had a story to tell my PhD committee!!

These are photomicrographs of pendant calcite crystals which precipitated within meteoric aquifers that developed during late Ordovician sea-level falls....location... Appalachians...northern Georgia.


On left is a view of the crystal stained with potassium ferricyanide. Non ferroan early cements are not stained. Burial Fe rich calcite stains blue. On right is a view of the same crystal in cathodoluminescence (crystals are bombarded with cathode rays in a vacuum chamber).

Cathodoluminescence helps understand pore fluid fluctuations between oxidizing and reducing conditions. In oxidizing pore-fluids, neither Mn+4 or Fe+3 is incorporated into growing calcite crystals, and thus cements are black (non-luminescent). In pore fluids with progressively lower Eh , reduction of Mn first and then Fe leads to their incorporation into the growing cements, giving the crystals a bright to dull luminescence. The image on left shows the changing geochemistry of pore fluids from oxidizing to mildly reducing to reducing as the sequence got buried.
 
All this geochemistry makes more sense when placed in a stratigraphic context. The image below shows a cyclic late Ordovician sequence and the position of calcite cements within it. Cathodoluminescent signatures help constraint the lower limits of the fresh water aquifer that developed during successive sea-level drops.


During the first sea-level drop both vadose and phreatic meteoric conditions are recognized and groundwater fluctuated between oxic to mildly reducing. During the next sea-level drop (Ordovician-Silurian unconformity) the meteoric aquifer was reducing and only bright luminescent phreatic cements precipitated. The vadose zone is not preserved in the younger sequence.

This kind of cement stratigraphy helps understand the geochemistry and the lateral and vertical extent of groundwater systems and fluid flow patterns that develop as sea-level drops and basins are exposed to fresh water infiltration. Fluid - sediment interaction create and destroy porosity and permeability,  properties which in turn influence the hydrocarbon and mineral potential of the sedimentary sequence.

Monday, May 17, 2010

The Passionate Saga Of India's Spatial Data Infrastructure

Why passionate?.... feel free to scroll to the bottom of the post for that tidbit..

I've been having an email conversation with a reader about India's National Spatial Data Infrastructure (NSDI), the promised digital gateway to spatial data on the country's natural resources, urban infrastructure, demographic information and so on.

To summarize the technological components that need to be built for the NSDI to become functional -

1) Contributing agencies have to get their data digitized and metadata available to NSDI standards.

2) Contributing agencies have to develop web map applications to view and query this data.

3) The NSDI portal will be a centralized gateway to this data and applications and also provide additional mapping applications at various levels of user access.

Right now all this is still something of a mirage. The web portal is up but not quite functional, since all contributing agencies have yet to make available data and applications to access and query this data. Still the NSDI portal is an interesting place to visit if only to get a glimpse of its immense potential. A list of and links to the contributing agencies are available.

To those frustrated users of spatial data, conditioned by the stifling bureaucracy to filling out forms and waiting for months to get security clearances to use data, the prospect of a one click access to spatial data is a wish too good to be true and cannot come soon enough.

Some of this one click nirvana is already a reality with individual government and non-government initiatives publishing their data via web maps. I made a quick list of available services:

1) Bhoosampada- Indian government initiative to share land use land cover data

2) Bhuvan- Touted as a Google Earth killer, shares satellite images and some natural resources layers

3) Census India Maps: Indian government initiative to share census data.

4) The Indian Bioresources Information Network: Indian government initiative to share biodiversity and forest data. I have not been able to register as a user at the time of writing.

5) Central Ground Water Board Map Service: Government released data on groundwater. I have not been able to register to this at the time of writing.

6) Wasteland Information System: Government data on wastelands. This as yet appears to be an internal application, not released in to the public domain.

7) India Biodiversity Portal- Non-Government initiative to distribute natural resources and census data.

Besides these, no doubt there are plenty of internal applications being used by various government agencies. Eventually all these services will be absorbed under the NSDI umbrella along with the already named contributors and other new interested parties who want to part of this national data service.

I have been showering praise on government efforts so far. Now its time to turn around and give a sharp kick in the buttocks.

I have tried to register to a couple of these applications and have got no response from the contact personnel assigned to deal with this. A more friendly and responsive interface with potential and existing users must develop. Also all these above government applications need to be rethought from a design perspective. Users are becoming more aware of location based services and the slick interfaces through which such services are being rendered on their PC's and mobiles. The clunky interfaces of these government applications might turn away lots of users... and thirdly... usability...usability..usability... that should be the mantra. As of now the data structure, the menus and the query design...all assume specialist users. For the curious citizen not trained in navigating map services and not used to looking at underlying data,  it will be a tough slog to extract any useful information. The interfaces need to be simplified...

Finally, coming to the passionate part of this saga, I noticed a link on the lower right side of the NSDI portal titled "NSDI A Passionate Saga". Curious, I downloaded the document and found out it was a personal account of the building of the NSDI from concept to its as yet be fully realized status written by the people involved.

It was a bit like the documentaries you see on HBO these days about Hollywood movies.. "The Making Of...such and such"...

but keeping with Indian government policy...without the coy references to the sex scenes.

Thursday, May 13, 2010

Hiding Behind Per Capita Emissions Doesn't Make Us Cleaner Than West

I wish India emitted a lot more CO2 and its per capita emissions were comparable to the developed nations.

I say this because I get mad reading headlines like this one in Indian newspapers:

Greenhouse emission numbers out and we're cleaner compared to West

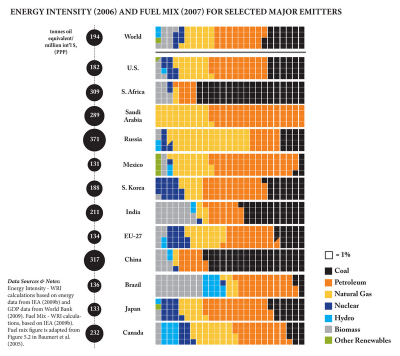
The article uses our low per capita emissions as an indicator that our economy is cleaner than the West. That is misleading. Take a look at energy sources and how efficiently we use that energy. Here is a graphic which compares India's energy intensity (efficiency) and fuel mix with other major emitters. We compare poorly with the West and most other developed nations when it comes to energy efficiency and we use similar proportions of dirty energy sources as most other countries.


Source:World Resources Institute


We emit less both absolute and per capita because of widespread poverty and huge energy shortfalls..because of energy required but not produced.

Hundreds of millions of people live subsistence lives and hundreds of millions more have a low energy footprint. These people have minimal access to energy and no amount of spin doctoring numbers about per capita emissions vs absolute emissions should be allowed to hide that fact. The media needs to keep hammering away at this reality and not write self-congratulatory articles on our low per capita emissions as if that is something to be celebrated.

In fact, there is absolutely nothing to celebrate in our current emissions profile.  Less per capita emissions is a reflection of a large poor population and not a clean energy economy.

I wish that for once our politicians will look us in the eye and admit the real reason for our low emissions instead of making pompous pronouncements on per capita emissions and I wish our stupid media looks beyond these exaltation's  and not get hoodwinked into giving comforting news bytes about being "cleaner" than the West.

Saturday, May 8, 2010

OneGeology Portal For Viewing Country Geology Maps

Here is a useful tool to explore over the weekend. A reader pointed me to the OneGeology Portal, a web map application that serves out 1 million plus scale (mostly) geology maps, country wise.

The portal is an initiative by various geological survey's to share digital geological data via a common web platform. The data is housed in contributing countries data servers and shared via a distributed web service.

Here is what the interface looks like.


It is very easy to navigate. You can't directly download actual spatial data..for that you have to contact the data owners. But you can save a KML file and then import that in some other web service like Google Earth. Or you can save a Web Map Context - which saves pointers to the layers you have displayed as an XML file - and import that as an overlay the next time you go online. That way the configuration of layers you have opened in one session can be saved. You can also copy and share the URL of the data server to use in some other mapping application like Google Earth or NASA World Wind. That allows you to mix your geological map with other non-geological data you may have stored elsewhere.

..sigh...... India has not contributed.. Afghanistan and Yemen have their data up but India doesn't. The Geological Survey Of India (GSI) has digitized geological data but is not.. how shall I put it... "into" data sharing as proactively as it should. For those interested, India geology data is available for viewing through the India Biodiversity Web Mapping application which I rank as the best public domain natural resources web mapping app in India. Someone has gone through the trouble to collate, digitize and upload that data, curiously with the permission of the GSI..one hopes the GSI takes a cue and develops its own data sharing infrastructure soon.

The OneGeology program is being administered by the British Geological Survey while the web mapping service is being hosted by the French Geological Survey.

Wednesday, May 5, 2010

Scenario: Gulf Oil Slick Might Piggback On Gulf Loop Current To U.S. East Coast

If..if ...if ...the winds change directions and blow southwards, the massive oil slick of the Louisiana coast might get caught up in the Gulf Loop Current and eventually make its way to the east coast.

Here is a depiction of the Gulf Loop Current:


Image credit: NASA's Earth Observatory/U.S. Naval Research Laboratory via Discovery News

The Gulf Loop Current is a clockwise current that flows in the Gulf of Mexico. It is strongest in the spring and summer and loops around the Florida Keys and joins the Gulf stream off the U.S east coast. Currently the slick is north of this current and the winds are blowing northwards bringing the oil to the gulf coastline of Louisiana, Mississippi, Alabama and Florida. The efforts to plug the leak though might take up to a couple of months if BP is forced to drill another well to inject sealants into the leaking well. The danger of winds changing direction in the interim and the slick moving south is real.

OnPoint Radio discusses the Deepwater Horizon rig disaster and its impact on the environment and the economy of the gulf coast region.

Elsewhere Chris at Highly Allocthonous writes about the every present danger and enhanced risk of spills and leaks that is inherent in increasingly complex energy projects like Deepwater Horizon which seek to recover energy from difficult to access areas and makes a pitch for better and stricter safety regulations to be made mandatory.

Monday, May 3, 2010

Would You Like This In Your BackYard?

Would you?


Source: Cape Wind Associates, LLC; Rendering of how the Cape Wind Project might look from the shoreline.

Science Friday discusses the Massachusetts Cape Wind project which might finally see the light of day after a decade of lawsuits.

A Note On Energy Density

An unpleasant example, but nonetheless a sobering reminder of just how much of an expansion in renewables will be needed to replace a significant slice of energy produced from fossil fuels.

Energy Outlook puts out some numbers:

Cape Wind and the Macondo prospect that the Deepwater Horizon rig was drilling into represent opposite poles of the energy spectrum, and not just because the latter is now leaking oil into the marine environment at a rate that the latest estimate puts at 5,000 barrels per day, much higher than initially thought. Cape Wind would tap into the clean and renewable, but extremely diffuse energy sources that surround us. After taking into account the restrictions imposed by DOI, its 130 turbines would on average generate as much electricity as a gas turbine power plant consuming a quantity of natural gas equivalent to 6,000 bbls/day of oil. In other words, it takes a very large array of offshore wind turbines to match the energy in the oil currently leaking from a single well. Platforms similar to what BP might have been planning to install after successfully completing the exploration of Macondo routinely produce up to 20 times that much oil.

The implications of this huge difference in energy density are clear. Without the energy concentration that nature has embedded in fossil fuels over many millennia, the hardware required to tap natural energy flows in real time becomes vast in extent.

Over at Science Friday the same point was made with regards to the potential of algae and microbes in producing fuels. They too suffer from the problem of capturing diffuse sunlight..the effect being that very large extents of land are required to produce significant quantities of fuel. The estimates given were a few thousand gallons of fuel per acre per year.

Currently the U.S uses about 275+ billion gallons of oil per year. Currently only a few percent of the liquid fuel needs of the U.S are met by biofuels.

Similar differences apply to the two fastest growing consumers of energy ..China and India.