Wired Science has put up a gallery of the best science visualization videos of 2009 selected through a contest. The Department of Energy handed out the prizes for the best ones at the Scientific Discovery through Advanced Computing conference (SciDAC).
The one of prime interest. A simulation of wave propagation of a 7.8 earthquake along the San Andreas
Video: DOE SciDAC Program/Amit Chourasia, Kim Olsen, Steven Day, Luis Dalguer, Yifeng Cui, Jing Zhu, David Okaya, Phil Maechling and Thomas H. Jordan
The animation required 12 terabytes of earthquake simulation data.

Monday, August 31, 2009
Thursday, August 27, 2009
Chicxulub Impact Crater: Not All About A Catastrophe
Let's take a breather from the K-T mass extinction debates.
From the August issue of Geology:
The surface geology of the site of the Chicxulub impact crater in northwestern Yucatán, Mexico, has not been studied extensively since the discovery of the crater almost two decades ago. Strontium isotope (87Sr/86Sr) measurements in carbonate rock outcrops reveal near-uniform strontium signatures of 0.70905 inside the ring of cenotes (water-filled sinkholes), which represents the rim of the crater basin. Measured strontium isotope ratios were used to infer rock ages, employing the marine Sr isotope curve. We estimate the age of the exposed limestone within the Chicxulub crater basin to be late Miocene to early Pliocene, representing the age of the youngest sediment fill. Discovery of a large terrain of near-uniform strontium isotope ratios in northwestern Yucatán offers new geoarchaeological opportunities to track ancient Maya migration and determine sources of manufactured goods. Our results have implications for applying the Sr isotope method to Maya archaeological sites, such as Mayapán, the last Maya capital, and Chichén Itzá.
Late Mesozoic impact resulting in ecosystem upheavals, faunal turnovers, chaotic sediment deposits followed later in the Cenozoic by serene limestone deposition.
The extended story of Chicxulub has an ironic ring to it. Uniformitarianism in a place which is one of the best known examples of catastrophism.
Tuesday, August 25, 2009
Images: Zeolites and Cavity Minerals From Deccan Basalts
Go to SpiriferMinerals.com for a photofest of zeolites and associated cavity minerals from the Deccan Basalts. Scolecite, Heulandite, Cavansite, Apophyllite.....I remember collecting all these from quarries in the Basalts. They often have textbook crystallographic form and the color combinations dazzle.
Take a look. I have posted just a few images below. Go here for the rest.


There are other images of India of archaeological interest on the site so its worth a visit.
Tip: Geology.com
Take a look. I have posted just a few images below. Go here for the rest.
Large vugs in Basalt lined with minerals

Green Apophyllite with Stilbite

Scolecite in a botryoidal form. The matrix appears to be Stilbite / Heulandite

There are other images of India of archaeological interest on the site so its worth a visit.
Tip: Geology.com
Monday, August 24, 2009

Friday, August 21, 2009
North India Facing Groundwater Calamity
Nature magazine has a great video of North India heading towards a water calamity. Groundwater is dropping more than 1 foot per year on average and over the last 6 years about 109 cubic km of water has been pulled out of aquifers underlying northwestern plains of India.
Recent measurements of water loss were done by twin satellites called GRACE – NASA's Gravity Recovery and Climate Experiment. These satellite orbit the earth at a set distance from each other and instead of taking measurements of objects directly below, they look at each other and measure changes in orbit due to variations in the pull of gravity.The result is summarized below. Red areas depict areas of groundwater loss and blue areas of groundwater gain.

Although striking, the measurements of the Punjab area should not come as a big surprise. Depletion of the groundwater table has been known to be taking place for many years but presenting the results in such a pictorial form and as volumes does make one sit up.
My attention however was drawn to the blue areas in the central parts of the country. They show a groundwater gain. This has been interpreted as due to above average rainfall for the last several years. No doubt that has played a role, but that hides a more general pattern.
I've written about this region before and the link between groundwater accessibility, use and farmer poverty.
Population densities of this dry interior region are less than the northern plains. Even so, groundwater is an underexploited resource per capita as compared with the northern plains of the country. Geology does play a big part in it. The terrain is all hard rock aquifers which are heterogeneous and compartmentalized and finding groundwater is not easy. Its also very expensive to dig a dug well or drill a bore well so many poor farmers end up relying on rains for their water needs. Vast tracts of this region are not supplied by surface irrigation canals and groundwater must be made more accessible if the widespread problem of reliable water supply to farmers is to be solved.
I want to put up this figure again to emphasize how important groundwater is to the Indian agricultural economy.

More than a decade on the importance of groundwater in agriculture holds and is growing. But till now groundwater has been seen as a resource to be extracted without giving any thought to the long term viability of such an approach. We need to change that mindset and steer it towards one that recognizes that just finding groundwater is not going to be enough. The sensible scientific management of the resource is just as crucial.
Maybe we still don't get it. Sadanand who blogs at Chintan has a post that highlights how we think about water and the solutions to scarcity. Irrigation canals and dams serve only 15% of arable land in India but that's what the apparent solution is in the minds of government and media alike. Groundwater which serves the rest and which will become even more important in the context of climate change is still being neglected.
Thursday, August 20, 2009
Geo Departments Recruit More Local Students Than Others
From AGI Geocurrent Magazine a survey that shows that undergraduate geology department in the U.S. recruit slightly more local students than other departments.
Percentage of students with Bachelors Degrees that graduated from High Schools in the same region (2003)

Any ideas about this pattern of recruitment? Could the difference be attributable to those high school students who got interested in geology by observing the rocks /fossils/ features around them and wanted to take advantage of local expertise to further their interests? Geology perhaps more than other fields does lend itself to such a regional influence although it would be interesting to see if this effect disappears at the graduate level. And what about the variations across country in the pattern?
There are geobloggers and readers with far greater experience in dealing with student enrollment patterns in the U.S. than me , so I am hoping to hear from them.
Monday, August 17, 2009
Indian Space Org's First Release Bhuvan Is A Dud
The Indian Space Research Organization just doesn't get it does it?
If it aspires to be player in the innovative and fast evolving world of web mapping applications, then a product launch that got so much pre -launch publicity needs to have a serious wow factor to it. It must shake up old and new users.
Agreed you may not have all the data and all the planned functionality ready but what you present to your audience should at least have the appearance of completeness. You should put out whatever best data you have and make sure all the tools and functions are in working order. Beta release and future potential are all well accepted processes and norms within the software industry, but web map users who have over the last few years become fat on a diet of elegant and increasingly sophisticated products are going to be making a spot judgment on what you have now.
Agreed you may not have all the data and all the planned functionality ready but what you present to your audience should at least have the appearance of completeness. You should put out whatever best data you have and make sure all the tools and functions are in working order. Beta release and future potential are all well accepted processes and norms within the software industry, but web map users who have over the last few years become fat on a diet of elegant and increasingly sophisticated products are going to be making a spot judgment on what you have now.
And for this first release of Bhuvan that means ....not much.
But I am getting ahead of myself. Ambuj Saxena beat me to it. He blogs at Devils Workshop and has a nice post on his experience with Bhuvan. I concur with many of his criticisms that Bhuvan has been hastily put together and users are going to get annoyed that it just doesn't stand up to its pre launch hype in terms of image quality and other functionality.
Albeit critical Devangshu Datta in an article on Bhuvan in the Business Standard takes a mellower and longer view and points to the potential of a product like this. I am more apprehensive for reasons I will elaborate later and I feel most users who want an immediate rich and inspiring experience will need some persuasion that Bhuvan can be significantly improved upon.
I just want to go through the four points I had raised in my speculative preview of Bhuvan and then add more thoughts on some of the details of the product and user experience.
1) Will the images from Bhuvan be superior to that provided by Google? - It is going to be a crushing blow to users who having followed the pre- launch announcements would have gone on Bhuvan expecting high resolution images of their cities and homes. ISRO decided to keep its best data away and instead serve up coarser data from its Linear Imaging Self Scanner (LISS) LISS 3 and LiSS 4 sensors aboard its IRS satellite series. That means a resolution ranging from about 24 meters to about 5 meters. ISRO has better data than this. Its Cartosat 1 satellite has been imaging India for the last 4 years and Cartosat 2 for the last one year. That data is 2.5 meters and 0.8 meters resolution resp. The quicker that comes online the better.
Right now Google products win hands down.
The image clarity issue has been a fiasco for ISRO. For months the media excitedly wrote that Bhuvan will be offering images much better than Google. ISRO kept silent and did not issue much needed correctives, thereby implicitly supporting the tripe the media was offering. Then after all this they go and offer us second level imagery. Its enough to turn away potential users in disgust.
The image clarity issue has been a fiasco for ISRO. For months the media excitedly wrote that Bhuvan will be offering images much better than Google. ISRO kept silent and did not issue much needed correctives, thereby implicitly supporting the tripe the media was offering. Then after all this they go and offer us second level imagery. Its enough to turn away potential users in disgust.
2) Will ISRO make other data available? - Yes, Bhuvan has administrative data like state, district and tehsil boundaries, transportation data like national highways and natural resources data like rivers, water bodies, wasteland, and soil. A limited selection but more might be on the way. I have more to say about data later in this post.
3) Will Bhuvan be like Google Maps or like Google Earth? - There was conflicting information on this. The indications were that Bhuvan might be like Google Maps, meaning a true web enabled mapping service. I guessed wrong in an earlier post. ISRO has decided to engineer it more like Google Earth. That means you have to download software. Bhuvan is a local application which gets only images from a remote server. Otherwise the application interface, all the menus, tools and other functionality is being served from your hard drive. This does make the interface more efficient and quick. I've heard quibbles about the 10 Mb download. But I would rather suffer a onetime download and then work with a fast interface than perpetually get frustrated waiting for the entire interface being served over a limited bandwidth.
The less known fact is that the 3D capabilities of Bhuvan, i.e. the app that lets us drape and visualize images in a 3D environment is actually being run from a tool called Terra Explorer a 3D environment geospatial application specialist owned by Skyline. ISRO has licensed Terra Explorer to serve as a foundation for Bhuvan. The rest of Bhuvan functionality is built on top of this Terra Explorer core.
I could not find this information anywhere in the documentation on their website. Ambuj mentioned this in his post. Curiously when I was playing around installing and uninstalling Bhuvan I got a notification .......Terra Explorer uninstalled!
I just had to laugh. So much for the chest beating and boasting that Bhuvan is an indigenous alternative to Google Earth.
4) Will ISRO allow open access to the Bhuvan API? - No indication that ISRO is going to allow an open API for customizing this product. This is a real pity. It will severely limit use of this product as innovators will flock to applications like Google Maps to create complex applications and mashups which means less use of ISRO imagery and data.
ISRO in fact may not be able to open up its API even if it wanted to because that may violate its licensing agreement with Terra Explorer.
On to some other concerns I have about Bhuvan -
a) Performance optimization for Indian users- Google Earth has a great feature. You can work offline. When you first go online and call up images for a certain area, those images at the zoom extent you have seeing them are stored in cache. You can go offline and work with those images from cache. You can't obviously call up any new images but if you are doing concentrated work on only one area you can work offline. ISRO missed out on this feature. Since the software resides on your computer working offline would have been a boon in Indian conditions where connectivity is erratic and where lots of users buy limited download packages from their ISP.
b) Elements of cartography, map layer control , aesthetics- Can we have a visual display of map layers that looks a bit professional please? As of now the most elementary principles of cartography and map layer control are missing. For example the icon for city is the default pin! And it doesn't scale to zoom extent. Boundaries and roads are not displayed with proper line thicknesses and polygon color fills can't be seen. Labels likewise don't scale and are garishly colored. ISRO needs to hire professional map makers and designers to work on this one.
c) Who is Bhuvan aimed at? I am becoming more puzzled by the question of which user community ISRO is trying to target. The fastest growing user base for mapping applications in India are people interested in urban location based apps. But ISRO has effectively shut itself from this potential user base. Currently the images are just too coarse for any meaningful urban visualization and analysis. Getting Cartosat 2 images online will bring images comparable to Google Maps within reach of Indian users.
But a deeper problem awaits. I suspect the Indian government does not have ownership of annotated detailed street maps and city feature layers. Over the years Urban GIS has been neglected by the government. The detailed street maps and annotations you see in apps like Google Maps for Indian cities have been collected by private players and have been licensed to Google. The government sees the need for detailed urban datasets and has launched the Urban Mapping Mission. But it may be years before the mission produces data and Bhuvan gets detailed street maps owned by the government.
The immediate option would be to license street maps from private owners but I doubt they will do that. And again even having detailed street maps will be of limited use to users and developers if they don't have an open API to build value added services on top of this base data.
Which leaves Bhuvan with users interested in natural resources.
d) Will even good natural resources data save Bhuvan? This is the one area where Bhuvan is claiming a clear advantage over Google products and services i.e. availability of Indian natural resources data sets. With this release rivers, wasteland and soil data layers are available for information retrieval. But again I have doubts. They layers are not exclusively found in Bhuvan. For example the elegantly designed India Biodiversity Portal already has several natural resources data sets online which overlap with what Bhuvan is offering. Another government venture Bhoosampada offers land use and land cover data from which you can extract wasteland info again overlapping with Bhuvan.
So I am not sure if Bhuvan can maintain a clear advantage over other services even in natural resources datasets. This problem will get exacerbated when the National Spatial Data Infrastructure brings even more datasets onto the public domain. Non government / private organizations are sure to mine them to create innovative products.
My fear is Bhuvan given the stuttering incremental way in which government works will always be lagging behind.
In summary for your India data needs:
For best imagery- Google Earth / Google Maps
For Urban Data Needs - Google Maps
For Natural Resources Data Needs - India Biodiversity Portal, Bhoosampada, Bhuvan
Also check out GeoCommons for India Census data. Its is another upcoming public domain mapping platform with improving India data sets.
A Beta release does not mean releasing a product which is virtually useless. And given the web mapping ecosystem in which Bhuvan is competing this product is incomplete to the point of being useless. It will certainly evolve and improve in the future and offer a specialized group of users an information retrieval and sharing system for natural resources and village level data but so will other products offering similar services and data sets. I don't see a broad user base for this application.
Wednesday, August 12, 2009
Images: 2 Calcite Stalactites
Over From The Panda's Thumb a stunning photo of a stalactite

Photograph by Quentin Cobb
This is the Big Stalactite from Doolin Cave, Ireland. At 7.3 meters it is the largest stalactite in Ireland and it contains about 33 tonnes of calcite.
The same geological processes work on a much smaller scale too. From the late Ordovician limestones of northern Georgia

These also are stalactites but they are a fraction of a millimeter in length and contain probably a few micrograms of calcite. In carbonate petrology jargon they are known as vadose cements because they precipitated in the vadose zone of a soil profile, i.e. the zone above the permanent groundwater table. Fresh water dissolves limestones and forms tiny cavities - micro mini caves - and calcite crystals precipitate in these cavities from calcite saturated water. Since the cavities are above the water table they are mostly filled with air. But tiny droplets of water are present adhering to the upper surfaces of cavity walls , held there by surface tension forces. Which is why vadose cements are often pendent in habit, that is they hang from the roofs of cavities and caves.
The different colors....? .. its the same crystal but on the left it has been stained using potassium ferricyanide, a dye commonly used in carbonate petrology studies to distinguish calcite with high amounts of iron (dyes blue) from non ferroan calcite. On the right is the same crystal viewed under cathodoluminesence. The crystal is bombarded with cathode rays in a vacuum chamber and the presence of activator ions like manganese makes the crystal glow in orange. Black bands are manganese poor (no activators) bands. Manganese gets incorporated in growing calcite crystals under oxygen poor reducing conditions. The alternating black and orange bands track the conditions as they fluctuated between oxidizing and reducing.
Not all vadose cements can be called micro-stalactites. In this case though the there has been dissolution of the limestone and formation of solution cavities. These vadose cements have formed on the roofs of these cavities.
Just like that giant stalactite from Ireland.
Tip: Panda's Thumb
Monday, August 10, 2009
Arunachal Pradesh With Chinese Place Names
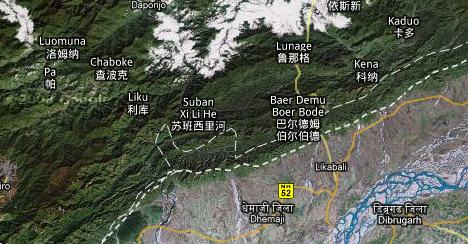
Ogle Earth has a nice write up on the recent mistake by Google Maps of placing Chinese place names on areas of Arunachal Pradesh. This is administered by India although China disputes India's authority over this region. The dotted white lines in the image below is the disputed Chinese version of political geography. Notice place names north of the white line (boundary between Assam and Arunachal Pradesh) are in Chinese, while those south of the line are in Hindi.

Source: Ogle Earth
Go read the article. It gives you a good idea about Google's policy regarding depiction of disputed border claims and the strange consequence of depicting different world borders depending upon which countries web servers the maps are being distributed from.
Friday, August 7, 2009
Human's Closest Relative: Chimps Or Orangs?
The Daily Show's John Oliver dives into this rancorous debate.
The researchers look way too serious. What a hoot!
Tip: Origins
| The Daily Show With Jon Stewart | Mon - Thurs 11p / 10c | |||
| Human's Closest Relative | ||||
| ||||
The researchers look way too serious. What a hoot!
Tip: Origins
Wednesday, August 5, 2009
I Finally Downloaded Aster 30 M Elevation Data
30 meter elevation data set for India, part of a global data set from the Advanced Spaceborne Thermal Emission and Reflection Radiometer (ASTER) is available for download free of charge from the NASA's Land Process Distributed Active Archive Centre.
The ASTER instrument has a steroscopic imaging capability in the near-infrared band. The elevation data is extracted from this stereo-data by auto-stereocorrelation of nadir (directly below ortho view)) and along-track oblique view of the ASTER sensors.
The data is partitioned into 1 deg by 1 deg tiles. So instead of downloading just one massive file you can download data in small chunks of about 8 Mb -12 Mb size. The download is a zip file. That's really convenient for users with slowish connections. The DEM upon extract is about 24 Mb. The download process requires a little patience. It has plenty of little intermediate steps you have to complete before the final order form is submitted. At the end of the process you will be emailed a ftp URL. You can pull your selected data set from that ftp folder. Do study the download tutorial before proceeding.
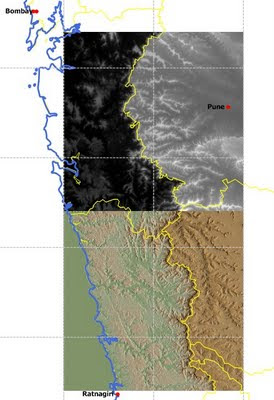
I got to know of it a few weeks back from a GIS forum I follow. Yesterday night I finally decided to test the download process. Within an hour I had registered an account , made my selection and downloaded elevation data for the region around Pune, India. See the image below. I imported the DEM in Manifold GIS and created a quick display. I have shown 2 tiles, only part of the data I downloaded. The upper tile is shown in a gray palette and the lower in a standard altitude palette. I have overlain a 0.5 deg graticule grid for reference.
Free data is always good news. Users though have to be careful when applying ASTER data for their various needs. ASTER is a relative DEM which means that the elevation data has been constructed entirely using the stereo-images with no corrections applied using ground control points. The positional accuracy and the feature integrity is determined by the knowledge of sensor parameters and shape of the geoid. Accuracy assessment of the ASTER product by comparing it with other DEM and ground control points suggests overall horizontal and vertical accuracy of about 20 m but may be worse locally. Topographic artifacts and inaccuracies in feature geometry also exist. Also although the elevations are posted at 30 m interval the details of topographic features that can be resolved appears to be about 100 m or so.
You can improve on ASTER data by reconstructing the DEM by inputting additional elevation information from ground control points in a competent raster processing software. But the raw data will have inaccuracies and so is not a good bet for any detailed work that needs highly accurate terrain information. Good enough to use as a backdrop and for reconnaissance and preliminary research purposes.
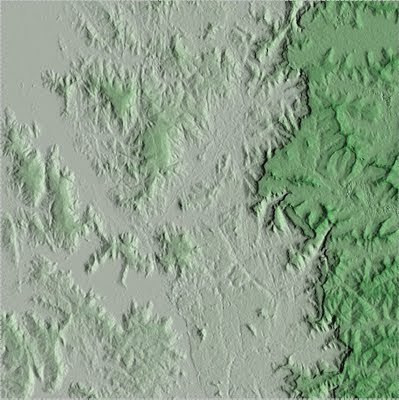
The image below is a close up of the West India coastal plains leading up eastwards to the western ghat escarpment (the sharp contrast between the light green and the dark green) and part of the plateau.
This is a welcome addition to the list of spatial data for India. A 30 arc second or 1 km resolution DEM is available for download free of charge from the USGS. You can also order elevation data for India from the Environment Information Centre, a Ministry of Env. and Forest data warehouse. This terrain model is extracted from source topographic maps of 1:50,000 scale and will have more positional accuracy and feature integrity than the raw ASTER output although it will be likely of coarser resolution. You will have to pay for this data set; about Rs 12,000 ($ 250/-) for every 100 sq km. A 30 m resolution data set (100 m in practice) improves on these older data sets in terms of resolution but not necessarily in terms of the accuracy.
NASA has indicated that this is the first release and improvements to this data set will follow in the future.
You can download data from this NASA data distribution site. There is a mirror site in Japan too.
The ASTER instrument has a steroscopic imaging capability in the near-infrared band. The elevation data is extracted from this stereo-data by auto-stereocorrelation of nadir (directly below ortho view)) and along-track oblique view of the ASTER sensors.
The data is partitioned into 1 deg by 1 deg tiles. So instead of downloading just one massive file you can download data in small chunks of about 8 Mb -12 Mb size. The download is a zip file. That's really convenient for users with slowish connections. The DEM upon extract is about 24 Mb. The download process requires a little patience. It has plenty of little intermediate steps you have to complete before the final order form is submitted. At the end of the process you will be emailed a ftp URL. You can pull your selected data set from that ftp folder. Do study the download tutorial before proceeding.
I got to know of it a few weeks back from a GIS forum I follow. Yesterday night I finally decided to test the download process. Within an hour I had registered an account , made my selection and downloaded elevation data for the region around Pune, India. See the image below. I imported the DEM in Manifold GIS and created a quick display. I have shown 2 tiles, only part of the data I downloaded. The upper tile is shown in a gray palette and the lower in a standard altitude palette. I have overlain a 0.5 deg graticule grid for reference.

Free data is always good news. Users though have to be careful when applying ASTER data for their various needs. ASTER is a relative DEM which means that the elevation data has been constructed entirely using the stereo-images with no corrections applied using ground control points. The positional accuracy and the feature integrity is determined by the knowledge of sensor parameters and shape of the geoid. Accuracy assessment of the ASTER product by comparing it with other DEM and ground control points suggests overall horizontal and vertical accuracy of about 20 m but may be worse locally. Topographic artifacts and inaccuracies in feature geometry also exist. Also although the elevations are posted at 30 m interval the details of topographic features that can be resolved appears to be about 100 m or so.
You can improve on ASTER data by reconstructing the DEM by inputting additional elevation information from ground control points in a competent raster processing software. But the raw data will have inaccuracies and so is not a good bet for any detailed work that needs highly accurate terrain information. Good enough to use as a backdrop and for reconnaissance and preliminary research purposes.
The image below is a close up of the West India coastal plains leading up eastwards to the western ghat escarpment (the sharp contrast between the light green and the dark green) and part of the plateau.

This is a welcome addition to the list of spatial data for India. A 30 arc second or 1 km resolution DEM is available for download free of charge from the USGS. You can also order elevation data for India from the Environment Information Centre, a Ministry of Env. and Forest data warehouse. This terrain model is extracted from source topographic maps of 1:50,000 scale and will have more positional accuracy and feature integrity than the raw ASTER output although it will be likely of coarser resolution. You will have to pay for this data set; about Rs 12,000 ($ 250/-) for every 100 sq km. A 30 m resolution data set (100 m in practice) improves on these older data sets in terms of resolution but not necessarily in terms of the accuracy.
NASA has indicated that this is the first release and improvements to this data set will follow in the future.
You can download data from this NASA data distribution site. There is a mirror site in Japan too.
Subscribe to:
Posts (Atom)